



Zveřejněno: 16 September 2026
Čas na čtení: 15 minut
Reviewer: Simon Scrapes, Founder
You’ve just finished a production run. Everything looked good on the line. Then your QC team runs X-ray inspection on those BGA components and your stomach drops. Voids. Way too many voids. Now you’re looking at rework, delayed shipments, and a root cause analysis that nobody wants to write.
Sound familiar? The difference between smooth SMT production and expensive headaches often comes down to one thing: your reflow soldering temperature profile.
Here’s what recent industry data tells us. Accurate thermal profiling can reduce solder joint defects by 40-60% by optimizing the preheat, soak, reflow, and cooling phases. A temperature deviation of more than 5 degrees Celsius across reflow oven zones is often enough to trigger recalibration. That’s not a small window.
The challenge has gotten bigger too. Lead-free solder alloys like SAC305 have been the standard since RoHS compliance became mandatory, but these materials demand more precise thermal management than the old tin-lead formulations ever did. We’re talking tighter windows, more sensitivity to ramp rates, and less tolerance for hot spots in your oven.
And here’s where it gets really tricky. Those BGA, QFN, and fine-pitch components everyone uses for high-density assemblies? They’re the most vulnerable to thermal profiling errors. Improper profiles can cause voids, head-in-pillow defects, opens on thermal pads, and a whole host of problems that trace right back to your oven settings.
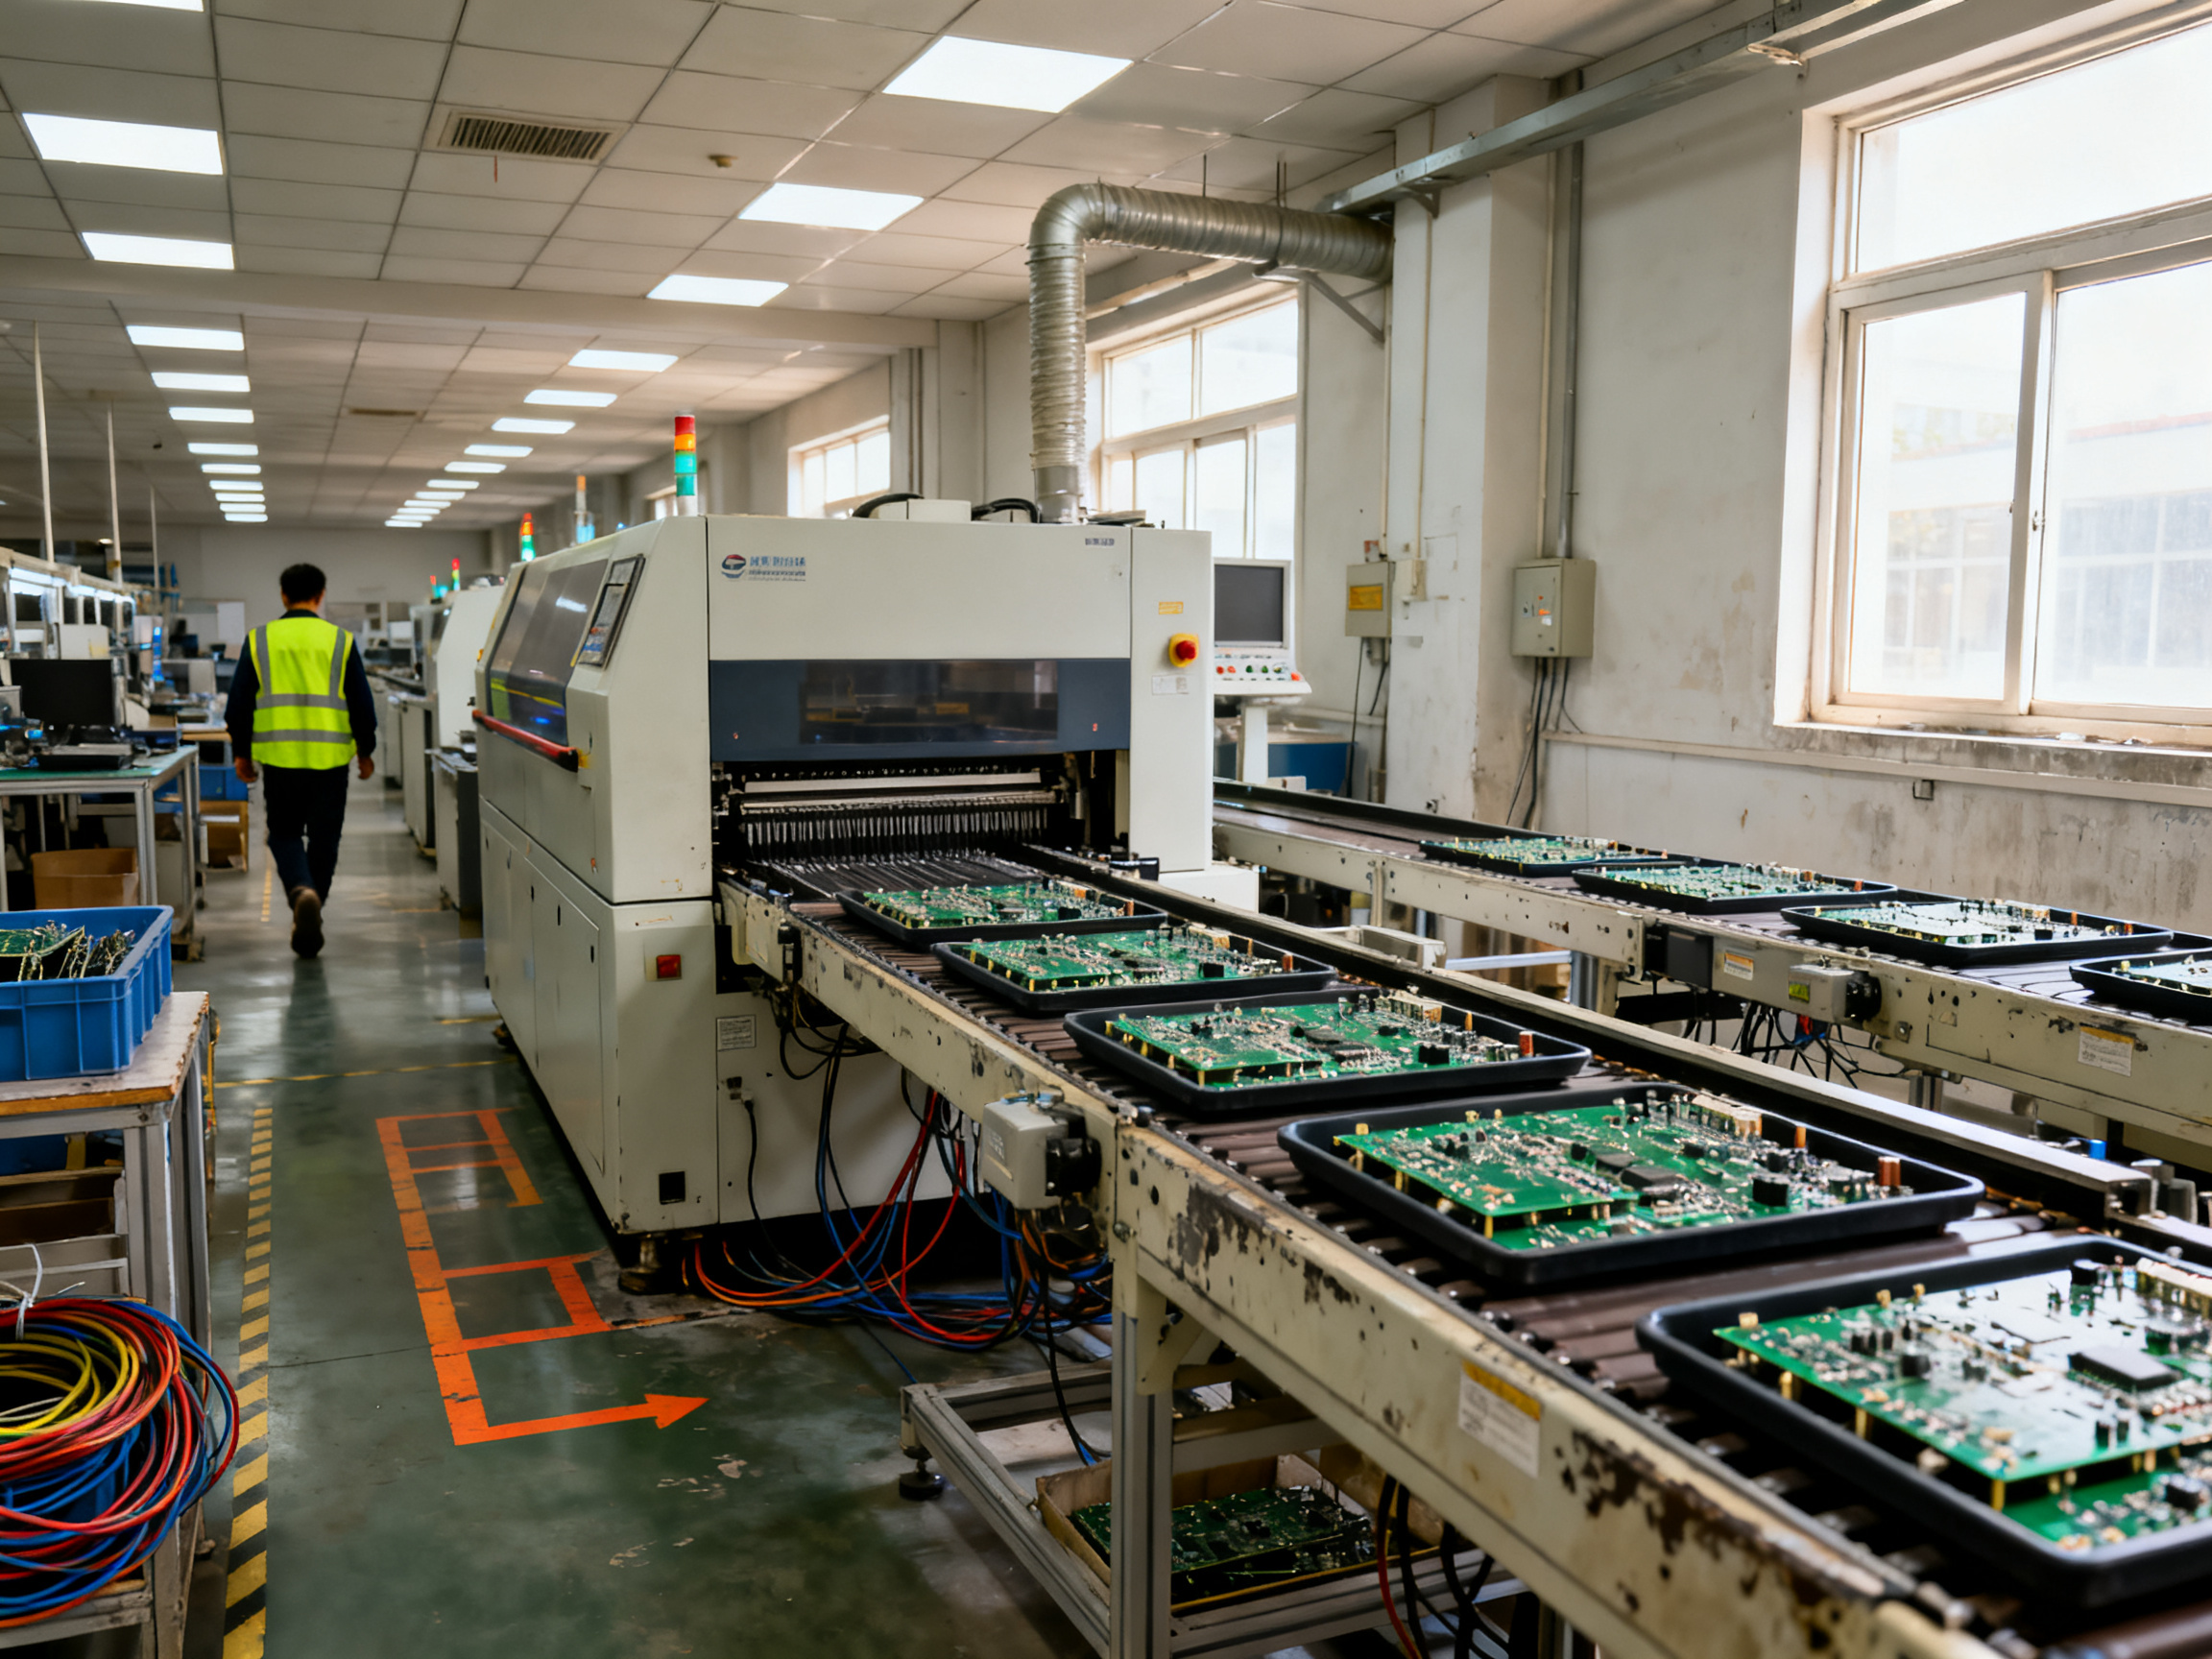
This guide cuts through the complexity. We’ll walk through the five stages of a reflow profile, how to measure and set your oven parameters, optimization strategies for lead-free alloys, and troubleshooting techniques that actually work on the production floor. By the time you’re done, you’ll have a clear path to profiles that deliver reliable solder joints and fewer late-night firefighting sessions.
Common SMT Defects and Their Thermal Root Causes
| Defect Type | Primary Thermal Cause | Typical Profile Issue |
|————-|———————-|———————-|
| Cold joints | Insufficient peak temperature or TAL | Low temperature, short time above liquidus |
| Tombstoning | Uneven heating rates | Excessive ramp rate, uneven preheat |
| Voids | Trapped volatiles, rapid heating | Fast ramp through volatile zone |
| Solder bridging | Excessive solder volume, over reflow | Peak temperature too high |
| Solder balls | Flux activation issues | Preheat ramp too slow or too fast |
| Head-in-pillow | Partial reflow, thermal lag | Insufficient TAL for large components |
These defects link directly to specific profile parameters, and once you understand the connection, diagnosis becomes much simpler.
Jace Liu is a technical specialist in SMT manufacturing processes and reflow soldering technology with extensive hands-on experience optimizing thermal profiles for high-density electronic assemblies.
The Science Behind Reflow Temperature Profiles: Thermal Dynamics Explained
Heat moves in predictable ways during reflow soldering, and getting a grip on these thermal dynamics is what lets you build profiles that actually work on the production floor.
How Heat Transfers During Reflow
Three mechanisms move heat around your oven: convection, conduction, and radiation. In most modern reflow ovens, forced convection dominates. Hot air moves across your board and components, carrying thermal energy wherever the airflow goes. This means uneven airflow equals uneven heating, period.
Conduction matters where components touch the board. Pins and leads conduct heat into packages. That’s why QFPs with lots of leads often heat more evenly than QFNs with just a few thermal connections.
Radiation contributes a smaller portion but becomes more significant at higher temperatures. Near peak, radiant heat helps fill gaps where convection falls short.
Here’s what trips up a lot of people. Every component on your board has a different thermal mass. A small 0402 resistor might weigh almost nothing thermally. A BGA with a copper heat spreader underneath? That thing acts like a heat sink and pulls energy away from nearby solder joints. Your profile has to satisfy both simultaneously, or some joints will suffer.
Thermal Properties of Common Lead-Free Solder Alloys
Different alloys need different thermal inputs to reflow properly:
| Alloy | Solidus (°C) | Liquidus (°C) | Recommended Peak (°C) | Typical TAL (s) |
|——-|————–|—————|———————-|—————–|
| SAC305 | 217 | 220 | 240-250 | 60-90 |
| SAC405 | 217 | 219 | 240-250 | 60-90 |
| SACm (low-silver) | 217 | 228 | 245-255 | 60-90 |
SAC305 remains the workhorse for most manufacturers. The 0.5% silver content gives decent thermal cycling resistance without requiring dramatically higher peak temperatures. Low-silver options like SAC0307 are gaining traction for cost-sensitive applications, but they need tighter control because the process window narrows.
Why Thermocouple Placement Makes or Breaks Your Profile
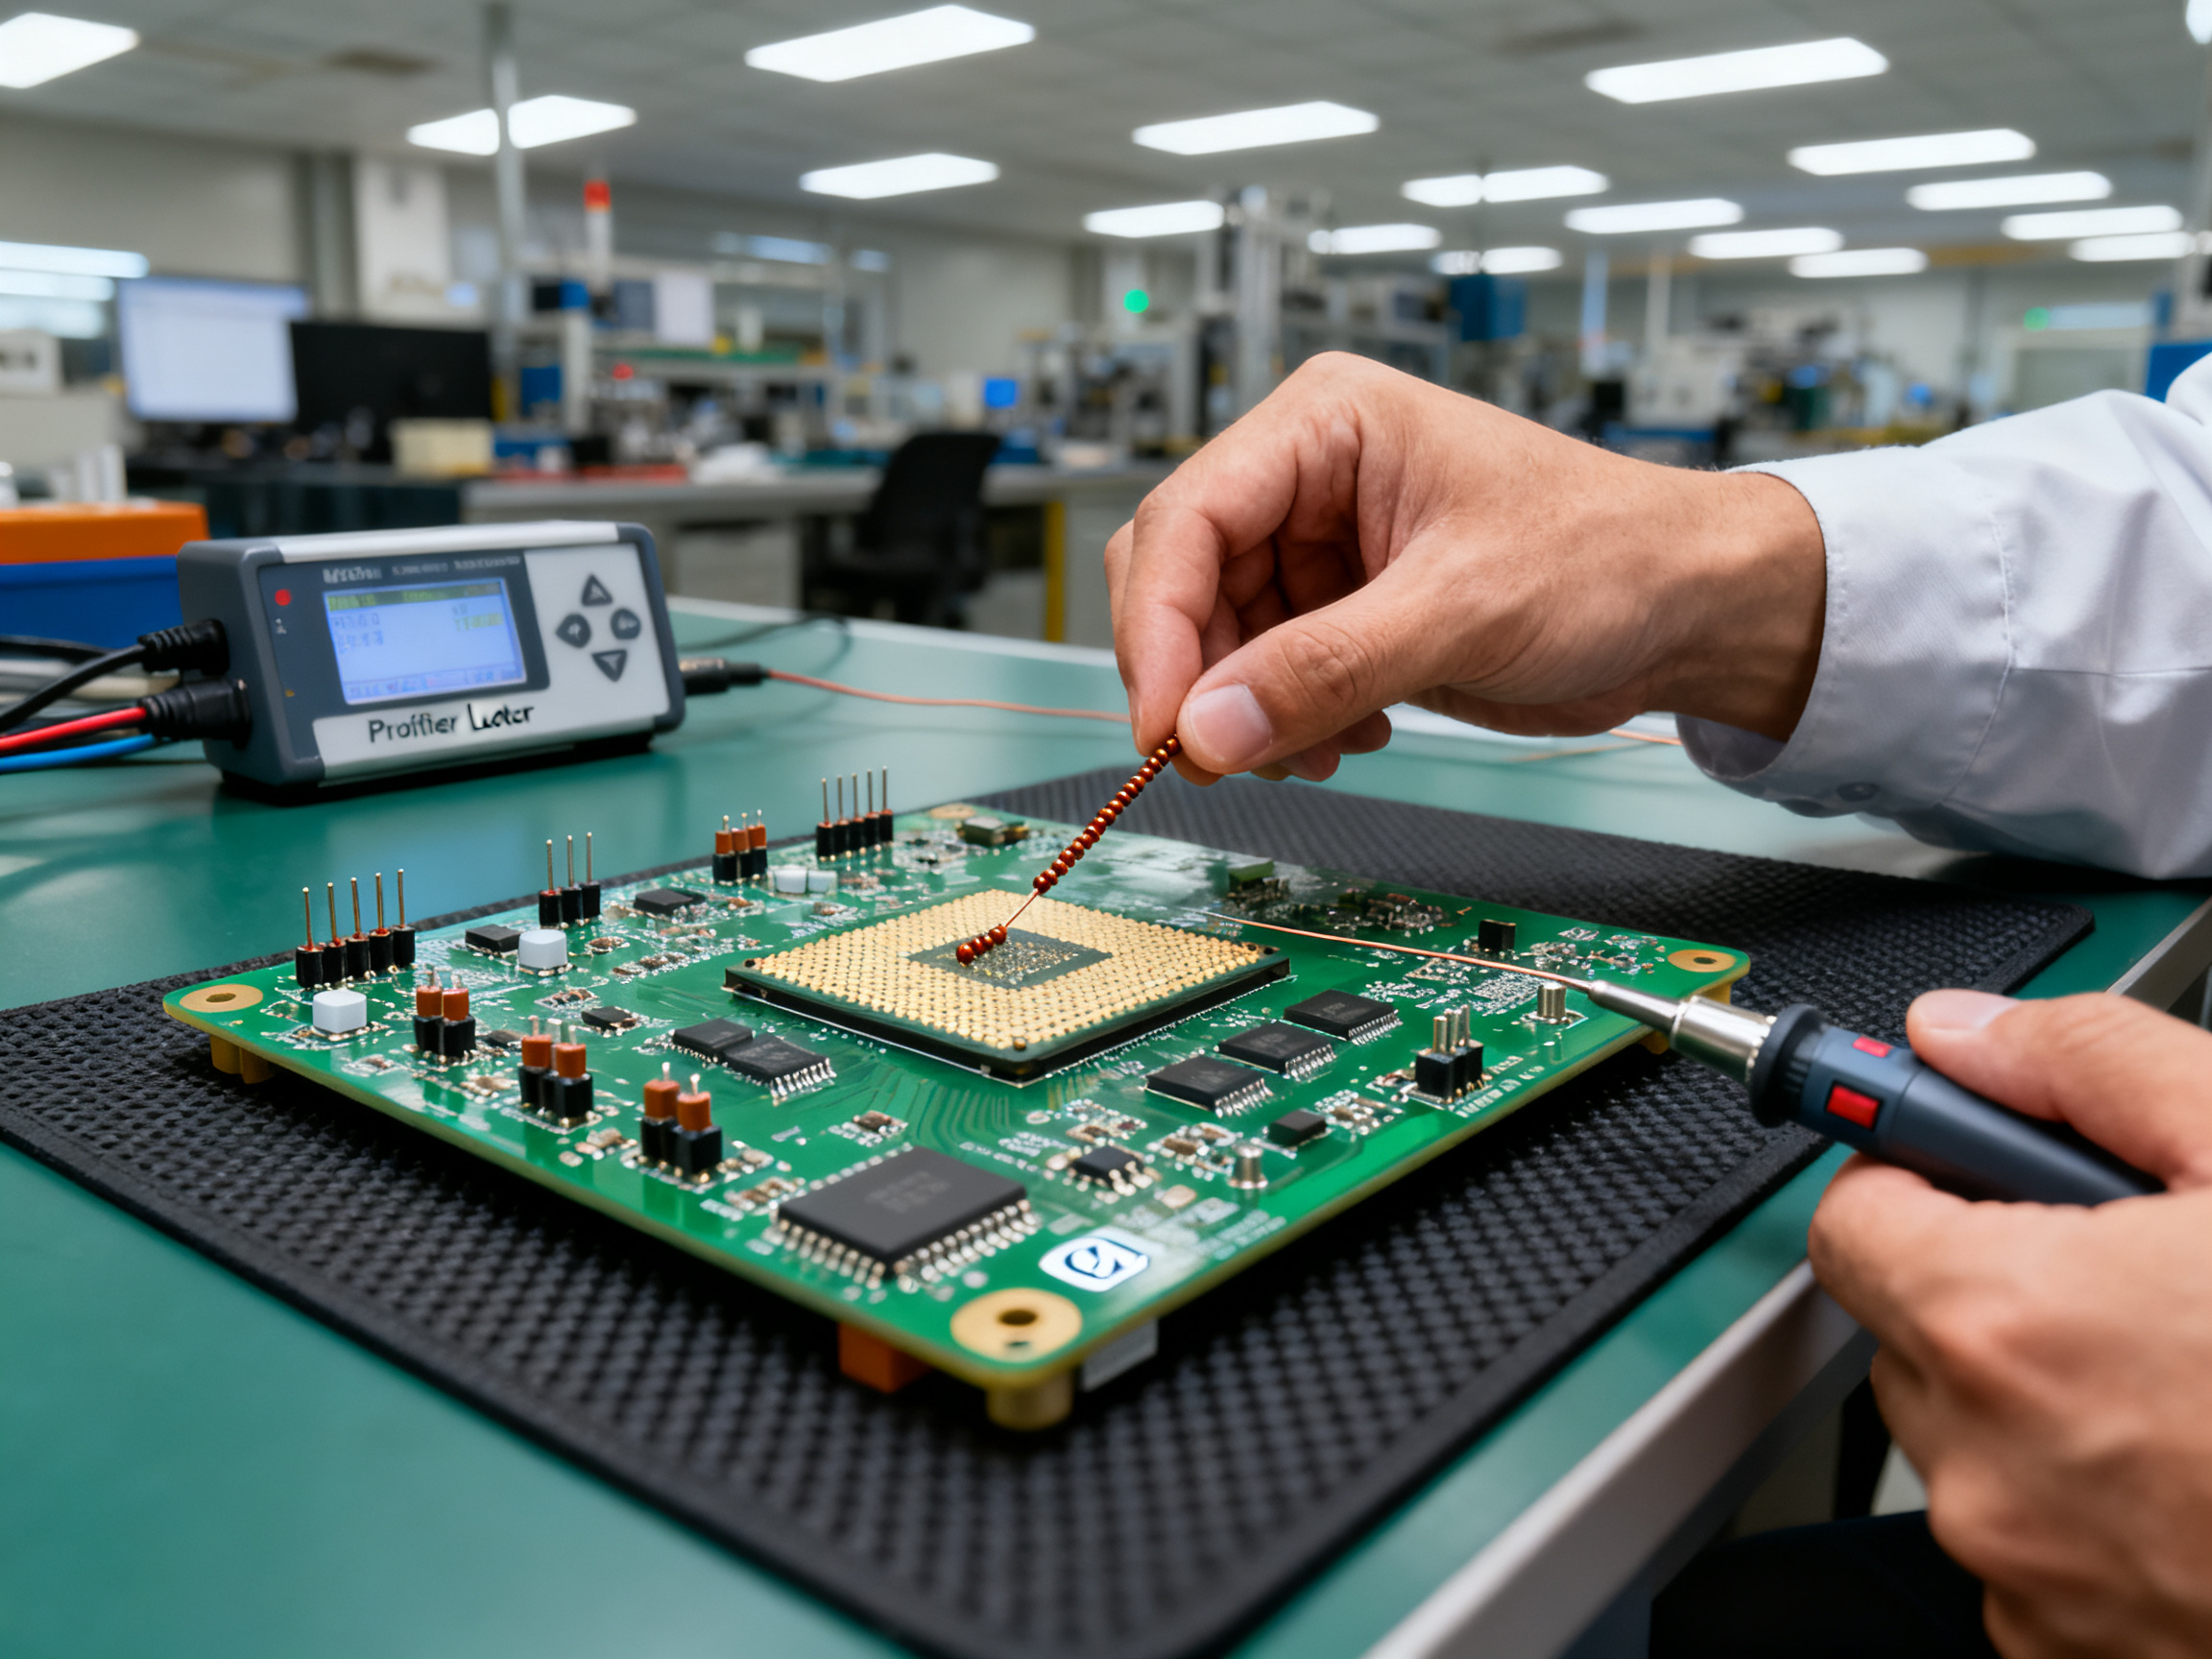
You cannot profile what you cannot measure, and measuring incorrectly gives you false confidence. Place thermocouples where temperatures actually matter most: at the highest mass components, at board edges and corners (usually the coldest spots), at the smallest components (usually the hottest), and at large copper planes that pull heat away.
For BGA and QFN packages, put at least one sensor directly adjacent to the thermal pad. The solder joint temperature can run 10-15°C cooler than nearby components if the pad design creates a thermal shadow.
Attachment matters as much as location. The bead needs to touch the measurement surface directly. Use high-temperature polyimide tape for temporary boards. Spot welding gives the best thermal coupling but requires compatible materials.
One more thing. Your thermocouples need calibration. A drifted sensor can make an out-of-spec profile look perfect, and you’ll ship defects without knowing why.
Pro Insight: When setting up thermocouples for mixed thermal mass boards, prioritize the delta-T between your heaviest BGA and lightest chip resistor. If that gap exceeds 20°C during any phase, your profile needs adjustment before you worry about absolute temperatures.
The science here is straightforward: heat flows from hot to cold, different materials absorb different amounts of energy, and your oven’s job is to deliver consistent thermal exposure across all of it. Get these fundamentals right, and the profile development process becomes much more predictable.
The Five Stages of a Reflow Temperature Profile: A Complete Breakdown
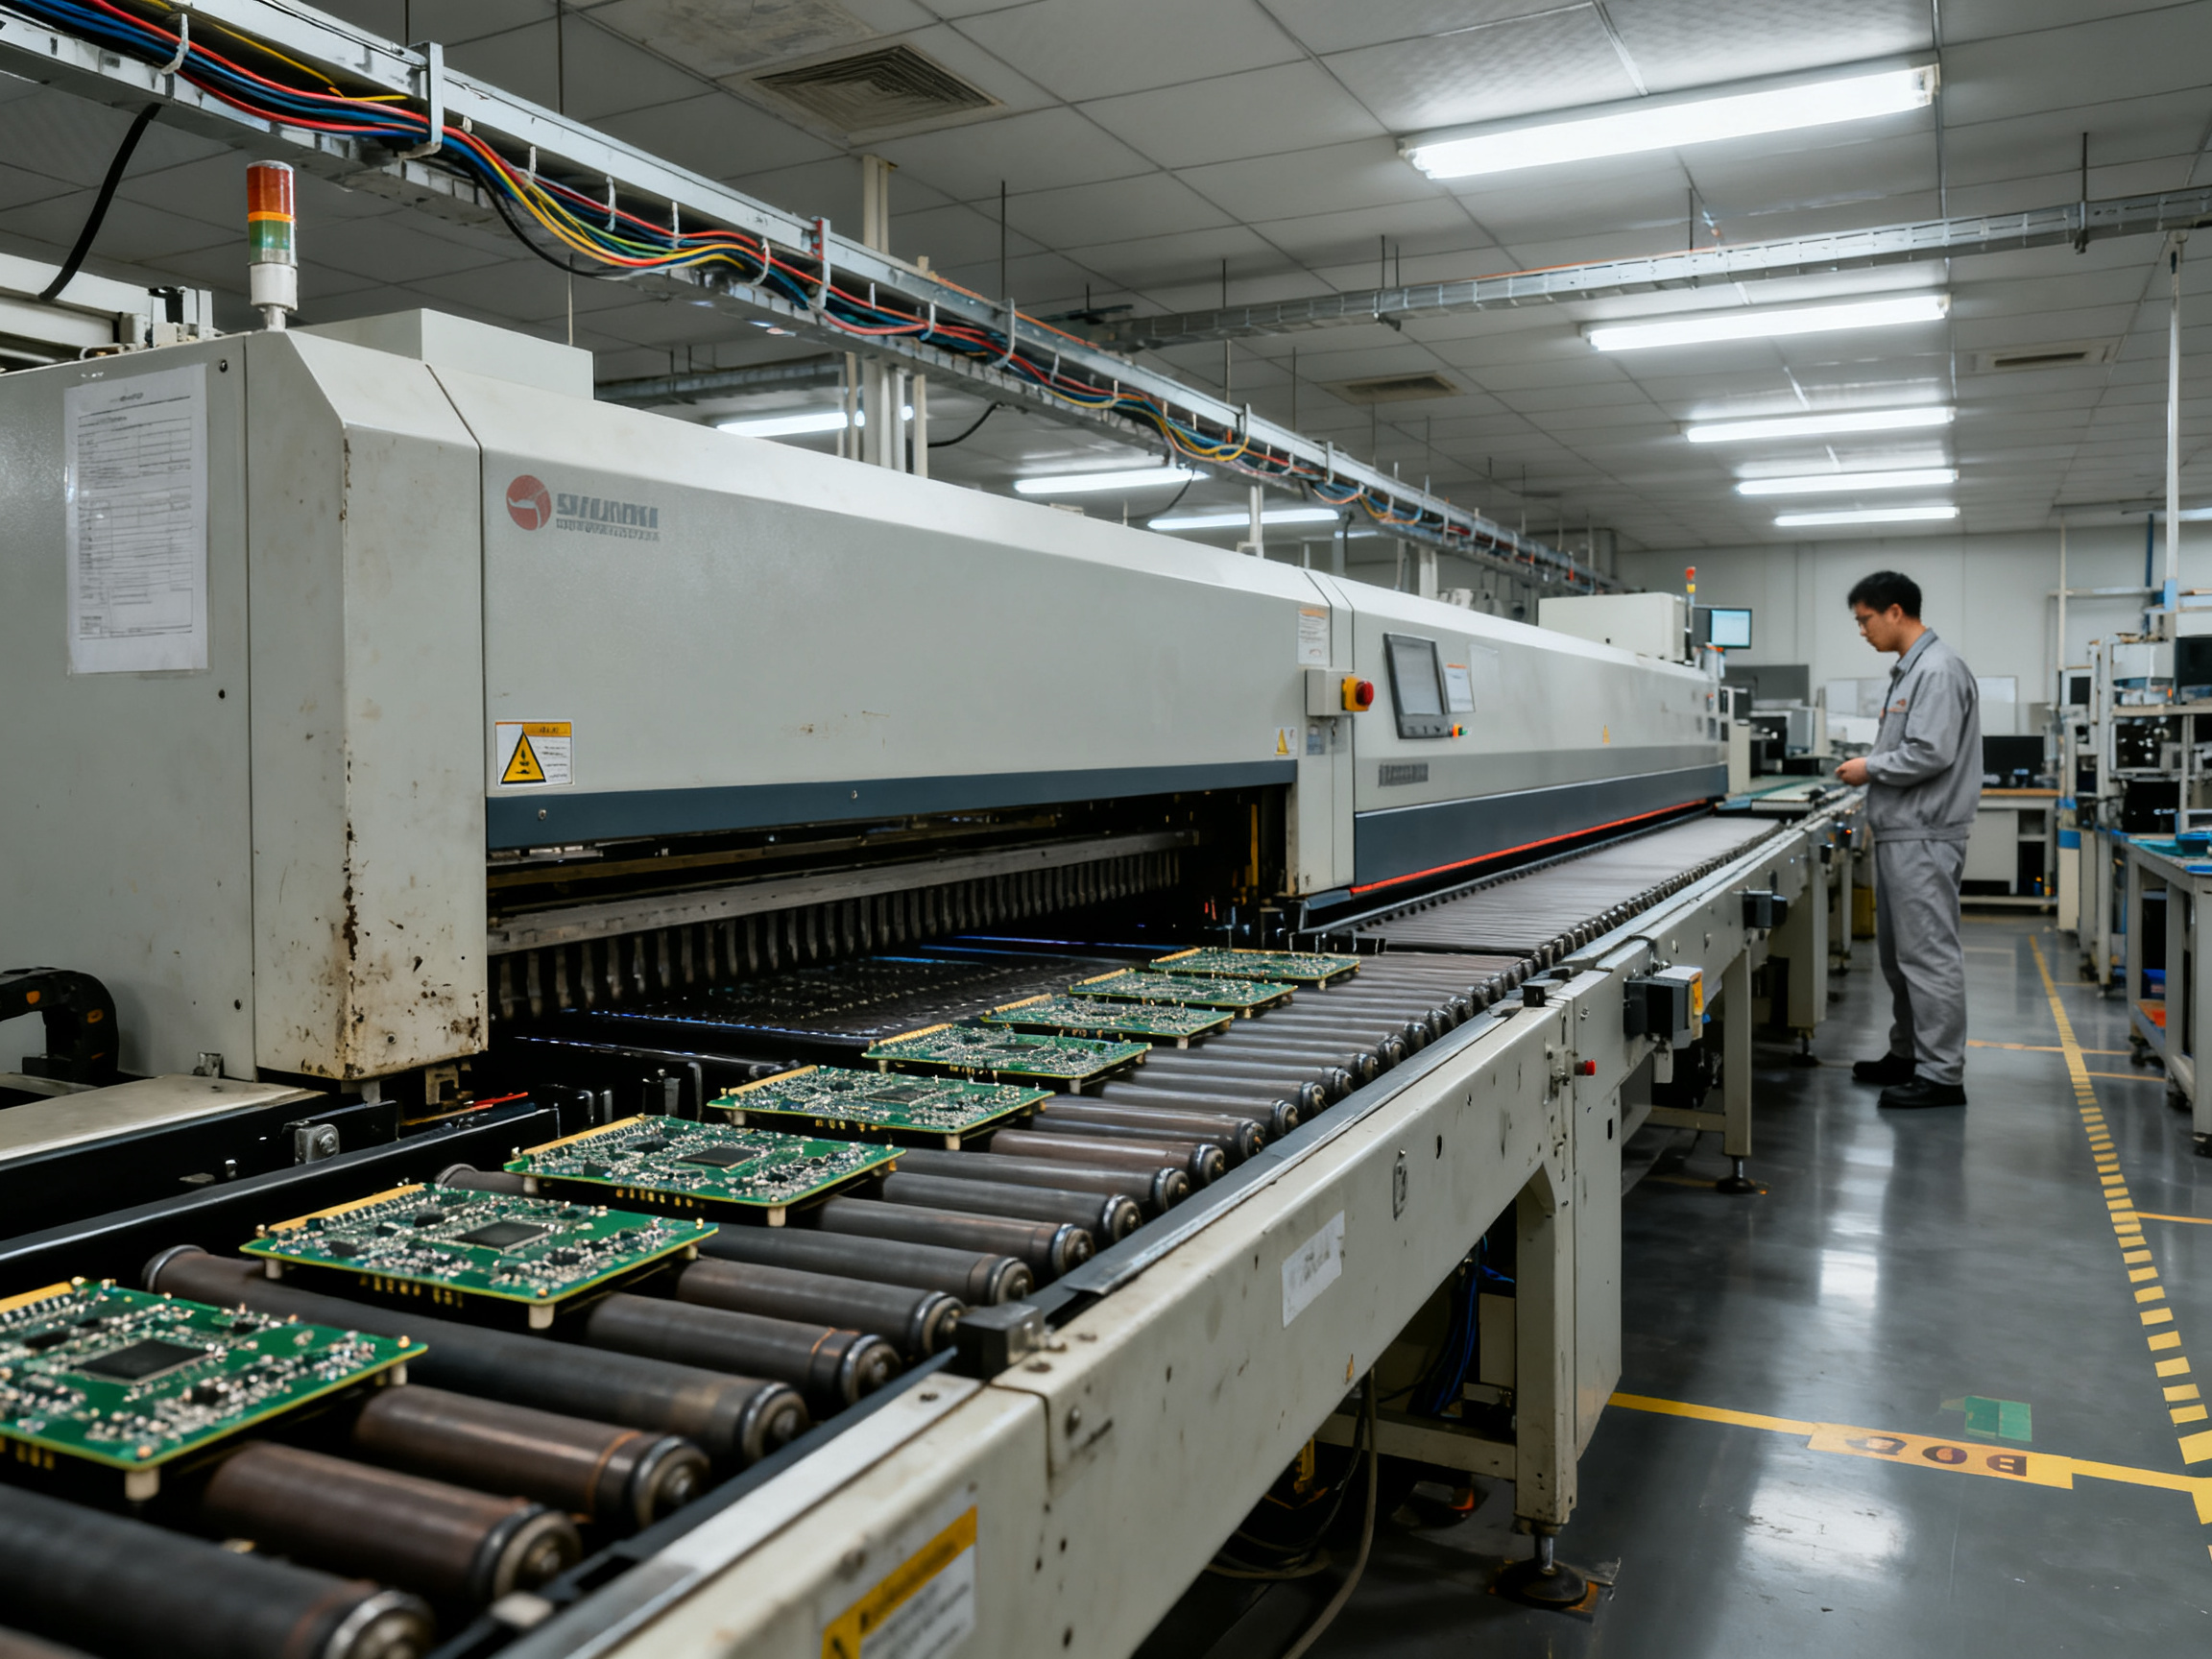
Every reliable solder joint traces back to a profile that respects five distinct thermal phases. Skip one, and you’re rolling the dice on your defect rate. Here’s what each stage does and why it matters.
Stage 1: Preheat (or Ramp-Up)
The preheat stage lifts your board from room temperature up to about 150 degrees Celsius. The goal is dual-purpose: activate the flux and get volatiles burning off before the solder melts. Rush this phase and trapped moisture inside components becomes a problem. Thermal shock can crack ceramic capacitors or damage moisture-sensitive packages.
A typical preheat ramp runs about 1 to 3 degrees Celsius per second. Too fast and you get tombstoning on small chip components. Too slow and you waste time or dry out your flux prematurely.
[Graph showing ideal reflow profile shape with labeled stages]
| Stage | Temperature Range | Typical Duration | Key Purpose |
|——-|——————|——————|————-|
| Preheat | Room temp to 150C | 60-120 seconds | Flux activation, volatile removal |
| Soak | 150-200C | 60-120 seconds | Temperature equalization |
| Ramp to Peak | 200C to 240-250C | 30-60 seconds | Controlled transition to liquidus |
| Reflow (Peak) | 240-250C | 45-90 seconds | Full solder melting and wetting |
| Cooling | 250C to room | 60-120 seconds | Controlled solidification |
Stage 2: Thermal Soak
The soak zone sits between 150 and 200 degrees Celsius and holds for roughly 60 to 120 seconds. This is where flux gets fully activated and the temperature gradient across your board narrows. Large BGAs and tiny 0402s finally agree on temperature before you push higher.
Flux needs this dwell time to clean oxide layers off the pads and component leads. Cut it short and you’ll see intermittent wetting failures that look like paste quality issues but trace back to your profile instead.
Stage 3: Ramp to Peak
The final climb to peak happens at a controlled rate, usually 2 to 3 degrees Celsius per second. You want to reach 240 to 250 degrees Celsius for SAC305 lead-free solder without overshooting. The peak needs to exceed the alloy liquidus by enough margin to allow proper wetting, but not so much that you risk component damage.
Time above liquidus (TAL) matters here. SAC305 stays liquid for about 60 to 90 seconds at typical peaks, giving the molten solder time to flow and form reliable intermetallic bonds with the pad surfaces.
Stage 4: The Cooling Zone
After peak, the cooling stage solidifies your joints. A controlled cooling rate around 2 to 4 degrees Celsius per second gives you fine-grained solder microstructures that resist thermal fatigue. Let it cool too fast and you get brittle joints. Too slow and you grow coarse grains that crack under thermal cycling stress.
Uneven cooling creates warping that pulls joints apart. That’s why thermocouple placement at board corners and edges matters so much.
Pro Insight: When setting up thermocouples for mixed thermal mass boards, prioritize the delta-T between your heaviest BGA and lightest chip resistor. If that gap exceeds 20 degrees Celsius during any phase, your profile needs adjustment before you worry about absolute temperatures.
Stage 5: Component Cooling (Beyond the Oven)
This final phase happens outside the reflow oven as your assembly reaches room temperature. Residual stresses from the thermal cycle work themselves out here. Proper support during this phase prevents board flex that could crack newly formed joints.
Here’s the thing though. These five stages don’t operate in isolation. They’re a connected sequence where each stage sets up the next. A weak preheat stresses the soak. A poor soak makes hitting your peak target harder. Build the profile as a system, not a checklist, and your process windows open up considerably.
Modern reflow ovens from manufacturers like S&M Co. Ltd. offer precise zone control that makes hitting these targets more consistent across high-volume runs. But even the best equipment needs a well-designed profile to deliver on that potential.
Measuring and Setting Your Reflow Oven Parameters: Tools and Techniques
Getting your reflow oven settings right means nothing if your measurements are off. Garbage in, garbage out, right? That’s why thermocouple placement and attachment deserve just as much attention as your zone temperatures.
Thermocouple Attachment Methods: What Works Best
How you attach thermocouples to your board changes what you’re actually measuring. Each method has trade-offs.
Spot welding gives you the best thermal coupling. The bead fuses directly to the pad surface, so you get the most accurate reading of actual joint temperature. Downside? You need compatible metals, and spot welding takes more setup time.
High-temperature polyimide tape works well for quick checks. Stick the bead to the board surface and go. The tape adds a thin insulating layer, so readings run slightly cooler than reality. For production profiling, this offset needs to be accounted for.
Epoxy and adhesive attachment holds thermocouples firmly in place. But too much adhesive creates insulation and skews readings. Use the smallest amount that gets the job done. Some epoxies also outgas at high temperatures and create their own thermal events.
Spring clips and magnetic holders offer convenience but can shift during the profile run. If your thermocouple moves mid-cycle, your data is worthless.
From Our Experience: We learned the hard way that polyimide tape alone shifts on heavy boards. Now we use tape plus a small dab of high-temperature epoxy at the bead itself. The tape holds it in place, the epoxy ensures contact. Takes maybe 30 seconds extra per sensor but the readings are rock solid.
Strategic Thermocouple Placement: Where to Put Sensors
Placement follows a simple rule: measure where temperatures matter most and where they’re most likely to vary.
| Location Type | Why It Matters | What to Watch |
|————–|—————–|—————|
| Largest thermal mass component | Hottest spot risk, slowest to heat | Make sure it reaches peak |
| Smallest component | Fastest heating, can overshoot | Watch for thermal shock |
| Board corners and edges | Usually the coldest areas | ΔT across board |
| Large copper planes | Heat sinks pull energy away | Thermal shadow effects |
| BGA and QFN thermal pads | Critical joint areas | Direct wetting zone |
For mixed-mass boards, put at least six sensors minimum. More is better when you’re first developing a profile. Once you understand your board’s thermal behavior, you can reduce to monitoring points.
For BGA packages specifically, place sensors adjacent to the thermal pad. The solder joint can run 10-15 degrees Celsius cooler than nearby components if the pad design creates a thermal shadow. Missing this means your BGA voids while everything else looks perfect.
Calibrating Oven Parameters Together
Your reflow oven has three main controls that work as a system: conveyor speed, zone temperatures, and air velocity. Changing one affects the others.
Rychlost dopravníku sets your dwell time in each zone. Slower conveyor means longer exposure. This is your primary control for time above liquidus. Most profiles run between 50-80 centimeters per minute, but your paste datasheet and board thermal mass will dictate the right speed.
Zone temperature settings create the thermal profile shape. Each zone should have a defined role: preheat, soak, reflow peak. Zone temperatures typically range from 180-280 degrees Celsius depending on the zone and your alloy.
Air velocity matters more than most people realize. Forced convection moves heat across your board, but uneven airflow creates hot and cold spots. Some ovens let you adjust fan speed per zone. If yours doesn’t, verify uniformity across the width of your conveyor with a multi-point profile.
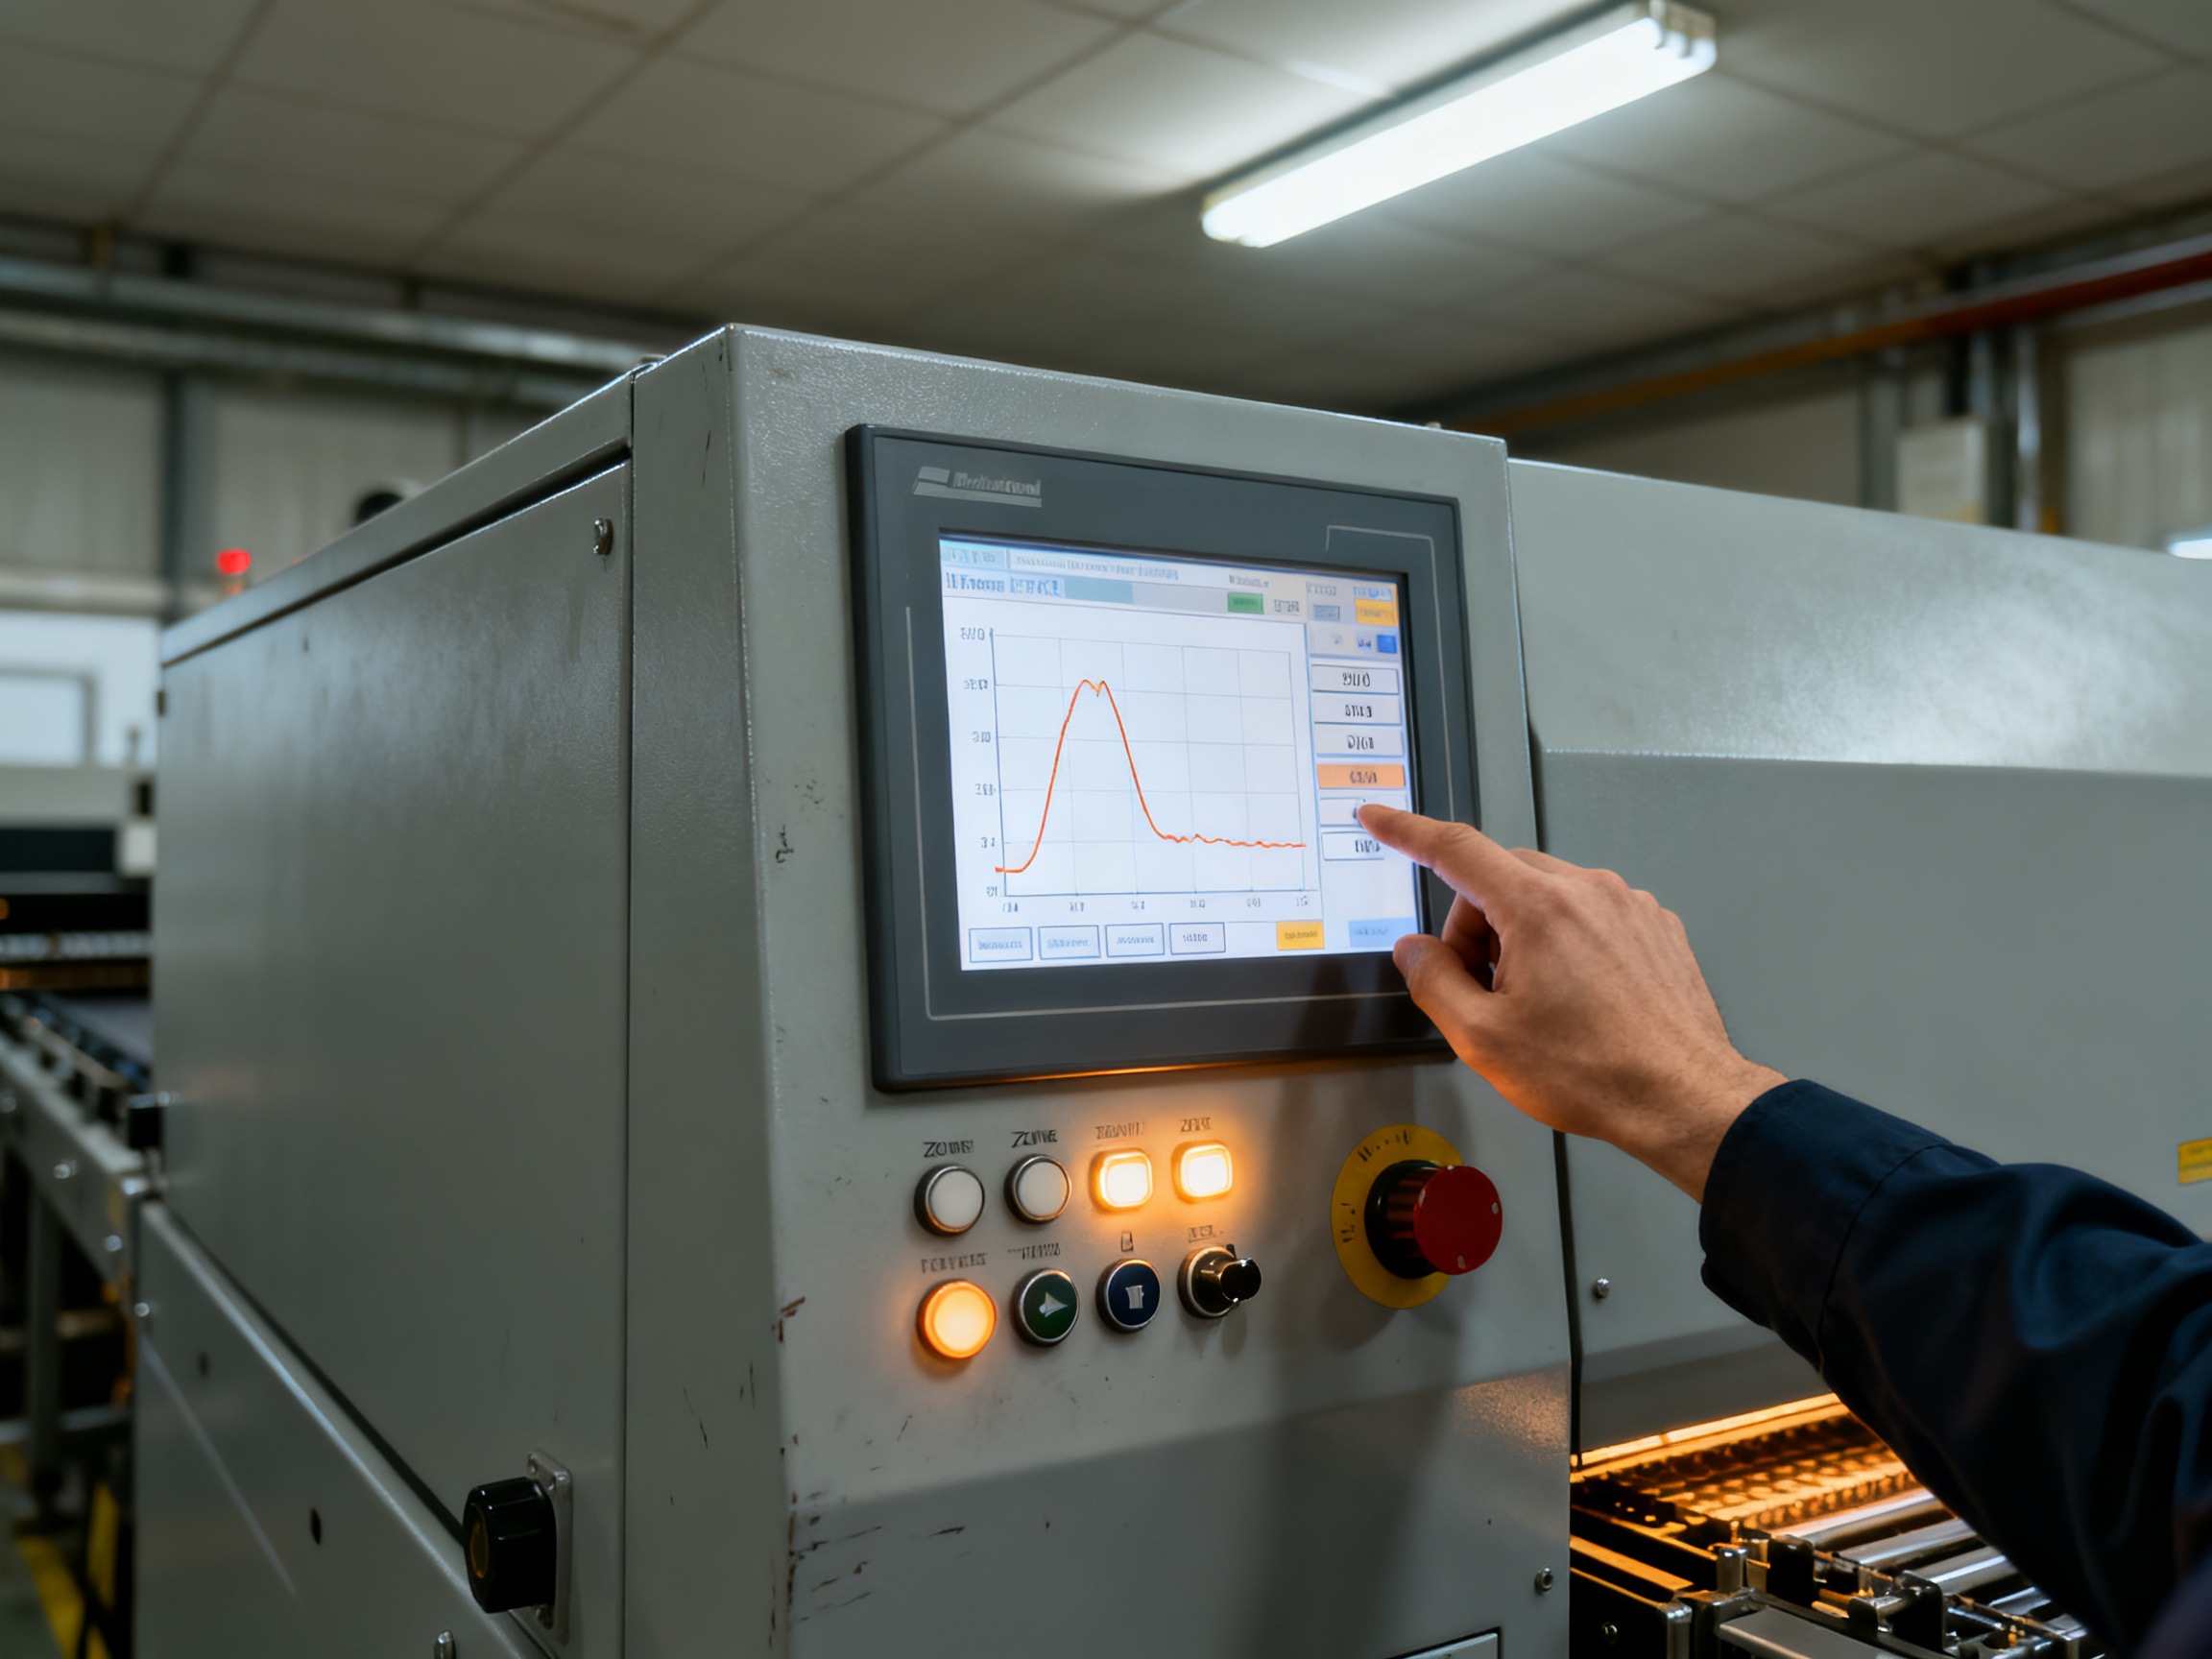
Here’s a practical starting point for SAC305 lead-free profiling on a typical board:
- Set conveyor speed first based on board length and desired TAL
- Configure zone temperatures using your paste datasheet as a guide
- Run a profiling pass with thermocouples at critical locations
- Adjust zone temperatures to hit target temperatures at each stage
- Verify ΔT across board is within acceptable limits
- Repeat until stable
Profile Measurement Errors and Corrections
| Error Symptom | Likely Cause | Correction |
|————–|————–|————|
| Readings drift over multiple runs | Thermocouple degradation, drift | Replace sensors, verify calibration |
| ΔT too high across board | Uneven airflow, zone imbalance | Check and clean air filters, recalibrate zones |
| Peak temperature lower than setpoint | Conveyor too fast, low zone temp | Slow conveyor, increase zone temp |
| TAL too short | Conveyor speed too fast | Slow conveyor, check for drafts |
| Readings fluctuate wildly | Loose attachment, bad connection | Secure attachment, check connector pins |
| Cold spots on board edges | Edge cooling, airflow issues | Add edge clips, adjust airflow deflectors |
Verifying Your Profile: The Golden Board Approach
Once you’ve developed a solid profile, save it as your baseline. Run the same board periodically to verify nothing has drifted. Weekly checks catch problems before they become defects.
Modern profilers from companies like KIC and others offer automated profiling and data analytics that flag deviations automatically. Some newer systems in 2026 even integrate AI-assisted thermal analysis to predict when your oven is starting to drift before it affects your product. This is a big deal if you’re running high-mix production where recipe changes are frequent.
The goal is to know your oven so well that profile verification becomes routine, not detective work. When something does drift, you’ll spot it immediately because you know what normal looks like.
Ready to optimize your profiles for specific lead-free alloys? Let’s dig into that next.
JEDEC Standards and Compliance: Meeting Industry Reflow Requirements
If you’re shipping products that need to work reliably for years, industry standards aren’t optional extras. They are the baseline that keeps your customers happy and your returns low. Two frameworks matter most for reflow profiling: JEDEC and IPC. Here’s what you need to know about both.
JEDEC J-STD-020: The Moisture Sensitivity Standard
JEDEC J-STD-020F (published in December 2022 and still current as of 2026) defines how manufacturers classify surface mount components for moisture sensitivity. This matters because moisture trapped inside packages turns to steam during reflow, and steam means cracked components.
Each SMD package gets assigned a Moisture Sensitivity Level from MSL 1 (basically immune to moisture) up to MSL 8 (extremely sensitive). Your profile needs to stay within the thermal limits defined for each MSL classification, or you risk damaging components before the solder even melts.
| MSL Level | Floor Life (out of dry bag) | Peak Classification Temp (°C) | Typical Packages |
|———–|—————————|——————————|——————|
| MSL 1 | Unlimited at ≤30°C/85%RH | Per component | Hermetic, ceramic |
| MSL 2 | 1 year at ≤30°C/60%RH | Per component | Some plastic ICs |
| MSL 2a | 4 weeks at ≤30°C/60%RH | Per component | Many QFPs, SSOPs |
| MSL 3 | 1 week at ≤30°C/60%RH | Per component | TQFPs, many QFNs |
| MSL 4 | 72 hours at ≤30°C/60%RH | Per component | Fine-pitch packages |
| MSL 5 | 48 hours at ≤30°C/60%RH | Per component | BGAs, some CGAs |
| MSL 5a | 24 hours at ≤30°C/60%RH | Per component | Large BGAs |
| MSL 6 | Mandatory bake before use | Per component | Very sensitive |
| MSL 7-8 | Special handling required | Per component | Critical moisture sensitive |
The standard defines peak temperature classifications (260°C, 245°C, 240°C, and so on) that components must survive. Your reflow profile cannot exceed the component’s rated peak temperature, even if your solder paste datasheet wants a higher target. The tighter wins.
One thing the latest J-STD-020F clarified: if you already classified a component under an earlier revision, you do not need to reclassify unless you want a different MSL or a higher peak temperature. This saves paperwork, but it also means older documentation might still be valid even if it looks outdated.
IPC Standards: Acceptance Criteria for Solder Joints
JEDEC tells you what thermal exposure your components can handle. IPC tells you what the finished joints need to look like. IPC-A-610J (released March 2024) is the current visual acceptance standard for assembled boards. It defines what acceptable solder joints look like after reflow, including fillet formation, wetting quality, and defect categories.
The big change in Revision J was removing the old Target category. Now you have three bins: Acceptable, Process Indicator, and Defect. Process Indicators are marginal conditions that do not justify rejection but do flag process attention.
IPC-J-STD-001J governs the soldering process itself and works hand-in-hand with IPC-7530B for thermal profiling guidance. Think of it this way: a well-developed reflow profile from J-STD-001J and IPC-7530B produces joints that should pass IPC-A-610J inspection. Bad profiles create defects that inspection catches, but why ship defects you could have prevented?
RoHS and REACH Compliance Documentation
Lead-free compliance is not just about using the right alloy. You need paperwork that proves your process meets RoHS and REACH requirements. Auditors want to see that your profiles have been verified, your materials are documented, and your production records exist.
Here is a quick compliance checklist:
Documentation Required:
- Approved reflow recipe with revision control
- Thermocouple calibration records (traceable to standards)
- Profile verification data (peak temp, TAL, ramp rates, soak)
- Oven model and serial number records
- Component MSL documentation from suppliers
- Lot traceability for solder paste used
- Production date and operator records for each run
- Any deviation records and corrective actions
Keep these records for at least the product lifetime plus a buffer. Some industries require 10+ years of retention. Cloud-based MES systems now automate much of this tracking, which reduces human error and makes audits much less stressful.
RoHS/REACH Compliance Checklist:
- [ ] Solder paste datasheet confirms RoHS compliance
- [ ] Reflow profile stays within component MSL limits
- [ ] Profile verification performed on new board designs
- [ ] Weekly oven characterization documented
- [ ] Thermocouples calibrated within past 6 months
- [ ] Records archived with timestamp and operator ID
- [ ] Deviation reports filed for any out-of-spec events
Meeting these standards feels like a lot of overhead when you are just trying to get boards out the door. But the payoff is real. When a customer questions your quality, you hand them a profile report that shows exactly what happened on their boards. When an auditor shows up unannounced, you pull records instead of panicking.
We have helped dozens of manufacturers set up compliance documentation systems that fit their production volumes. The companies that treat standards as a burden always struggle more than the ones that build compliance into their daily workflow from the start.
Now that you understand what the standards require, let us look at how to optimize your profile for the specific lead-free alloys you are running.
Optimizing Your Reflow Profile for Lead-Free Alloys
When the industry moved away from tin-lead solder, we all learned something the hard way. Lead-free isn’t just a material swap. It’s a complete process rethink. The thermal demands are higher, the windows are tighter, and your profile needs to earn its keep in ways the old tin-lead recipes never required.
Why Lead-Free Alloys Need Different Profiles
Here’s the basic problem. Tin-lead solder melted around 183 degrees Celsius and stayed liquid happily. SAC305, the workhorse lead-free alloy, sits at 217 degrees Celsius solidus and doesn’t fully liquefy until 220 degrees. You need more energy to get there, and you need to hold that temperature long enough for proper wetting without cooking your components.
The numbers tell the story. Lead-free typically demands peak temperatures of 240-250 degrees Celsius, compared to less than 240 degrees for tin-lead. Time above liquidus runs 60-90 seconds instead of 30-60. And the process window itself narrows considerably. With tin-lead, you had breathing room. SAC305 gives you less margin for error.
Nitrogen Atmosphere: Help or Hindrance?
Nitrogen inert atmosphere can take some pressure off. At oxygen levels around 300-1000 ppm, solder wets more easily because there’s less oxidation competing for surface contact. You might get away with a slightly lower peak temperature, which helps component longevity. Sounds like a win, right?
Thing is, nitrogen systems consume more energy. Your oven works harder to maintain that atmosphere while also delivering the thermal profile. Some facilities see energy costs jump noticeably when running nitrogen. The practical advice? Use nitrogen when your board has expensive components or when you’re fighting wetting issues. Run air回流 when you can get away with it.
| Parameter | Tin-Lead Profile | Lead-Free Profile (SAC305) |
|———–|——————|—————————|
| Peak Temperature | 225-240°C | 240-250°C |
| Time Above Liquidus | 30-60 seconds | 60-90 seconds |
| Preheat Ramp Rate | 1-2°C/s | 1-3°C/s |
| Soak Zone | 150-180°C, 60-90s | 150-200°C, 60-120s |
| Cooling Rate | 2-4°C/s | 2-4°C/s |
| Process Window | Wider | Narrower |
Board Density Considerations
Component placement density determines whether you can run one profile or need separate recipes for top and bottom sides. High-mass components like large BGAs and power devices pull heat away from their surroundings. Light components like 0201 resistors and small chip packages heat faster and can overshoot.
When your board has components on both sides, the side facing the oven heating elements gets a different thermal experience than the side facing down. Bottom-side reflow happens when the board flips, and those components go through the profile after already experiencing one thermal cycle. Profile adjustments for the second pass are often necessary.
Expert Tip: When transitioning from tin-lead to SAC305, resist the urge to just raise your peak temperature and call it done. The ramp rates and soak timing matter just as much for lead-free alloys. We’ve seen manufacturers chase wetting problems for weeks when the real fix was slowing their preheat ramp.
Making the Lead-Free Conversion Work
Converting an existing profile from tin-lead to lead-free isn’t complicated, but it does require systematic changes. Start with your solder paste datasheet. It tells you the alloy’s thermal requirements. Then adjust zone temperatures upward, slow your conveyor slightly to increase TAL, and verify your soak is doing its job of equalizing temperatures before peak.
One thing nobody talks about enough: component compatibility. Your components need to survive the higher temperatures. Check your MSL ratings and confirm your peak won’t exceed component limits. A profile that produces beautiful joints on a sensitive BGA means nothing if that BGA cracked during reflow.
The good news? Lead-free technology has matured significantly. The alloys are stable, the profiles are well understood, and equipment handles them reliably. What used to feel like walking a tightrope in 2019 feels routine now. The knowledge is there. You just have to apply it.
Advanced Reflow Profile Strategies for High-Density Assemblies
BGA, QFN, and LGA packages have changed the game for thermal profiling. These components pack more functionality into smaller spaces, but they also bring more thermal complexity to the table. Getting profiles right for these packages separates smooth production runs from expensive rework nightmares.
BGA components are thermal masses unto themselves. Those large solder balls underneath the package act like heat sinks, pulling energy away from nearby joints. A slow ramp through the preheat zone (about 1.0 to 1.5 degrees Celsius per second) helps avoid trapping volatiles that turn into voids. Extended soak times give large BGAs a chance to catch up with smaller components before peak temperature hits.
QFN packages have exposed thermal pads that create their own profiling headaches. The large center pad can create thermal shadows, and a too-fast ramp will trap flux volatiles underneath. Controlled soak and peak temperatures around 240 to 245 degrees Celsius keep QFN thermal pads happy.
Mixed-technology assemblies with both leaded and lead-free components need compromise profiles. Lead-free demands higher peaks. Lead-based solder tolerates those peaks without issues, so targeting the lead-free window works fine in most cases. You sacrifice some process margin, but running separate profiles for each technology complicates production schedules unnecessarily.
Heavy copper planes and ground pours pull heat away from surrounding areas. These high-thermal-mass zones need more preheat energy and potentially slower conveyor speeds. A longer soak phase equalizes temperatures across the board before peak.
From Our Experience: We ran into recurring void issues on a BGA-heavy board last quarter. The profile looked perfect on paper, but X-ray inspection showed voids clustering under the largest package. Turned out the thermocouple placement missed the thermal shadow created by the copper heat spreader underneath the package. Moving the sensor and slowing the preheat ramp fixed it immediately. Always profile with sensors at the actual problem areas, not just where it’s convenient to attach sensors.
Component Package Thermal Requirements Comparison
| Package Type | Thermal Mass | Void Sensitivity | Special Considerations |
|————–|————–|—————–|———————-|
| BGA | High | Moderate to High | Ball geometry creates thermal lag, longer soak needed |
| QFN | Medium to High | Moderate | Thermal pad requires attention, watch for shadow effects |
| LGA | Variable | Moderate | Flat lands need consistent solder volume |
| SOIC | Low to Medium | Low | Most forgiving, standard profiles work well |
High-Density Assembly Profile Development Workflow
[Process flow diagram: “Design Review > Thermal Analysis > Profile Development > Validation > Production”]
- Review board design and component placement
- Identify high-mass components and thermal shadow zones
- Place thermocouples at critical locations
- Run initial profile measurement
- Analyze delta-T across the assembly
- Adjust preheat and soak parameters for thermal uniformity
- Verify peak temperature and TAL meet paste requirements
- Validate against component MSL limits
- Document and release for production
Modern AI-assisted profiling tools from KIC and similar manufacturers can now predict oven drift before it impacts your product. These systems analyze baseline data and flag deviations that human reviewers might miss. For high-mix production environments in 2026, this kind of predictive insight is becoming standard equipment rather than a luxury add-on.
Advanced reflow ovens like those from S&M Co. Ltd. incorporate closed-loop profile control that automatically adjusts zone temperatures to maintain thermal uniformity across high-density assemblies. The combination of smarter profiling tools and more precise equipment makes hitting tight process windows more achievable than ever.
Troubleshooting Common Reflow Profile Issues
Your profile looks perfect on paper. The thermocouple data checks every box. But somewhere between the oven exit and QC inspection, defects are happening. Sound familiar? The gap between textbook profiles and real-world results is where most troubleshooting happens. Here’s how to close it.
Reading Defects Like Thermal Fingerprints
Every solder joint defect tells a story about what happened during reflow. The trick is learning to read the evidence instead of guessing at causes.
Cold joints usually point to insufficient peak temperature or TAL that’s too short. The solder never fully melted and wet properly. You might see dull, grainy joints or areas where the paste never flowed into a proper fillet. Check your peak temperature first, then verify your time above liquidus is hitting at least 60 seconds for SAC305. Anything less and you’re gambling with wetting quality.
Tombstoning happens when one side of a component heats faster than the other. The molten solder on the hot side pulls the part upright like a tombstone. This typically traces back to uneven preheat or a ramp rate that’s too aggressive. Check your thermocouple data for delta-T between component sides. If you see more than 10 degrees Celsius difference during preheat, your ramp needs slowing down.
Header bridging on fine-pitch components usually means your peak temperature is running too hot or your TAL is excessive. The solder stays liquid too long and wicks across pads. Cutting peak by 5 degrees or reducing TAL by 15 seconds often fixes this without causing other problems.
BGA Voids: The Most Frustrating Defect
Void formation in BGAs drives engineers crazy because the causes aren’t always obvious. Here’s what the data tells us in 2026. The fastest path to voids is a ramp rate that’s too aggressive through the preheat zone. Flux volatiles get trapped before they can escape, and once the solder consolidates, those bubbles are locked in.
The fix sounds simple: slow your ramp to about 1.0 to 1.5 degrees Celsius per second through the 150 to 200 degree range. But it’s not just about speed. Your soak zone needs enough dwell time to let the temperature equalize across the board. A 60 to 90 second soak at 170 to 190 degrees Celsius gives large BGA packages a chance to catch up with smaller components before peak temperature hits.
From Our Experience: We had a recurring void nightmare with a customer board last quarter. Every BGA showed voiding above 15%, which failed their Class 3 requirements. The profile data looked fine, but when we dug deeper, we found the thermocouple placement missed the thermal shadow from a copper heat spreader underneath the package. Moving the sensor and slowing the preheat ramp from 2.5 to 1.2 degrees per second dropped voids to under 3% immediately. Always profile where the problems actually happen, not just where it’s convenient to attach sensors.
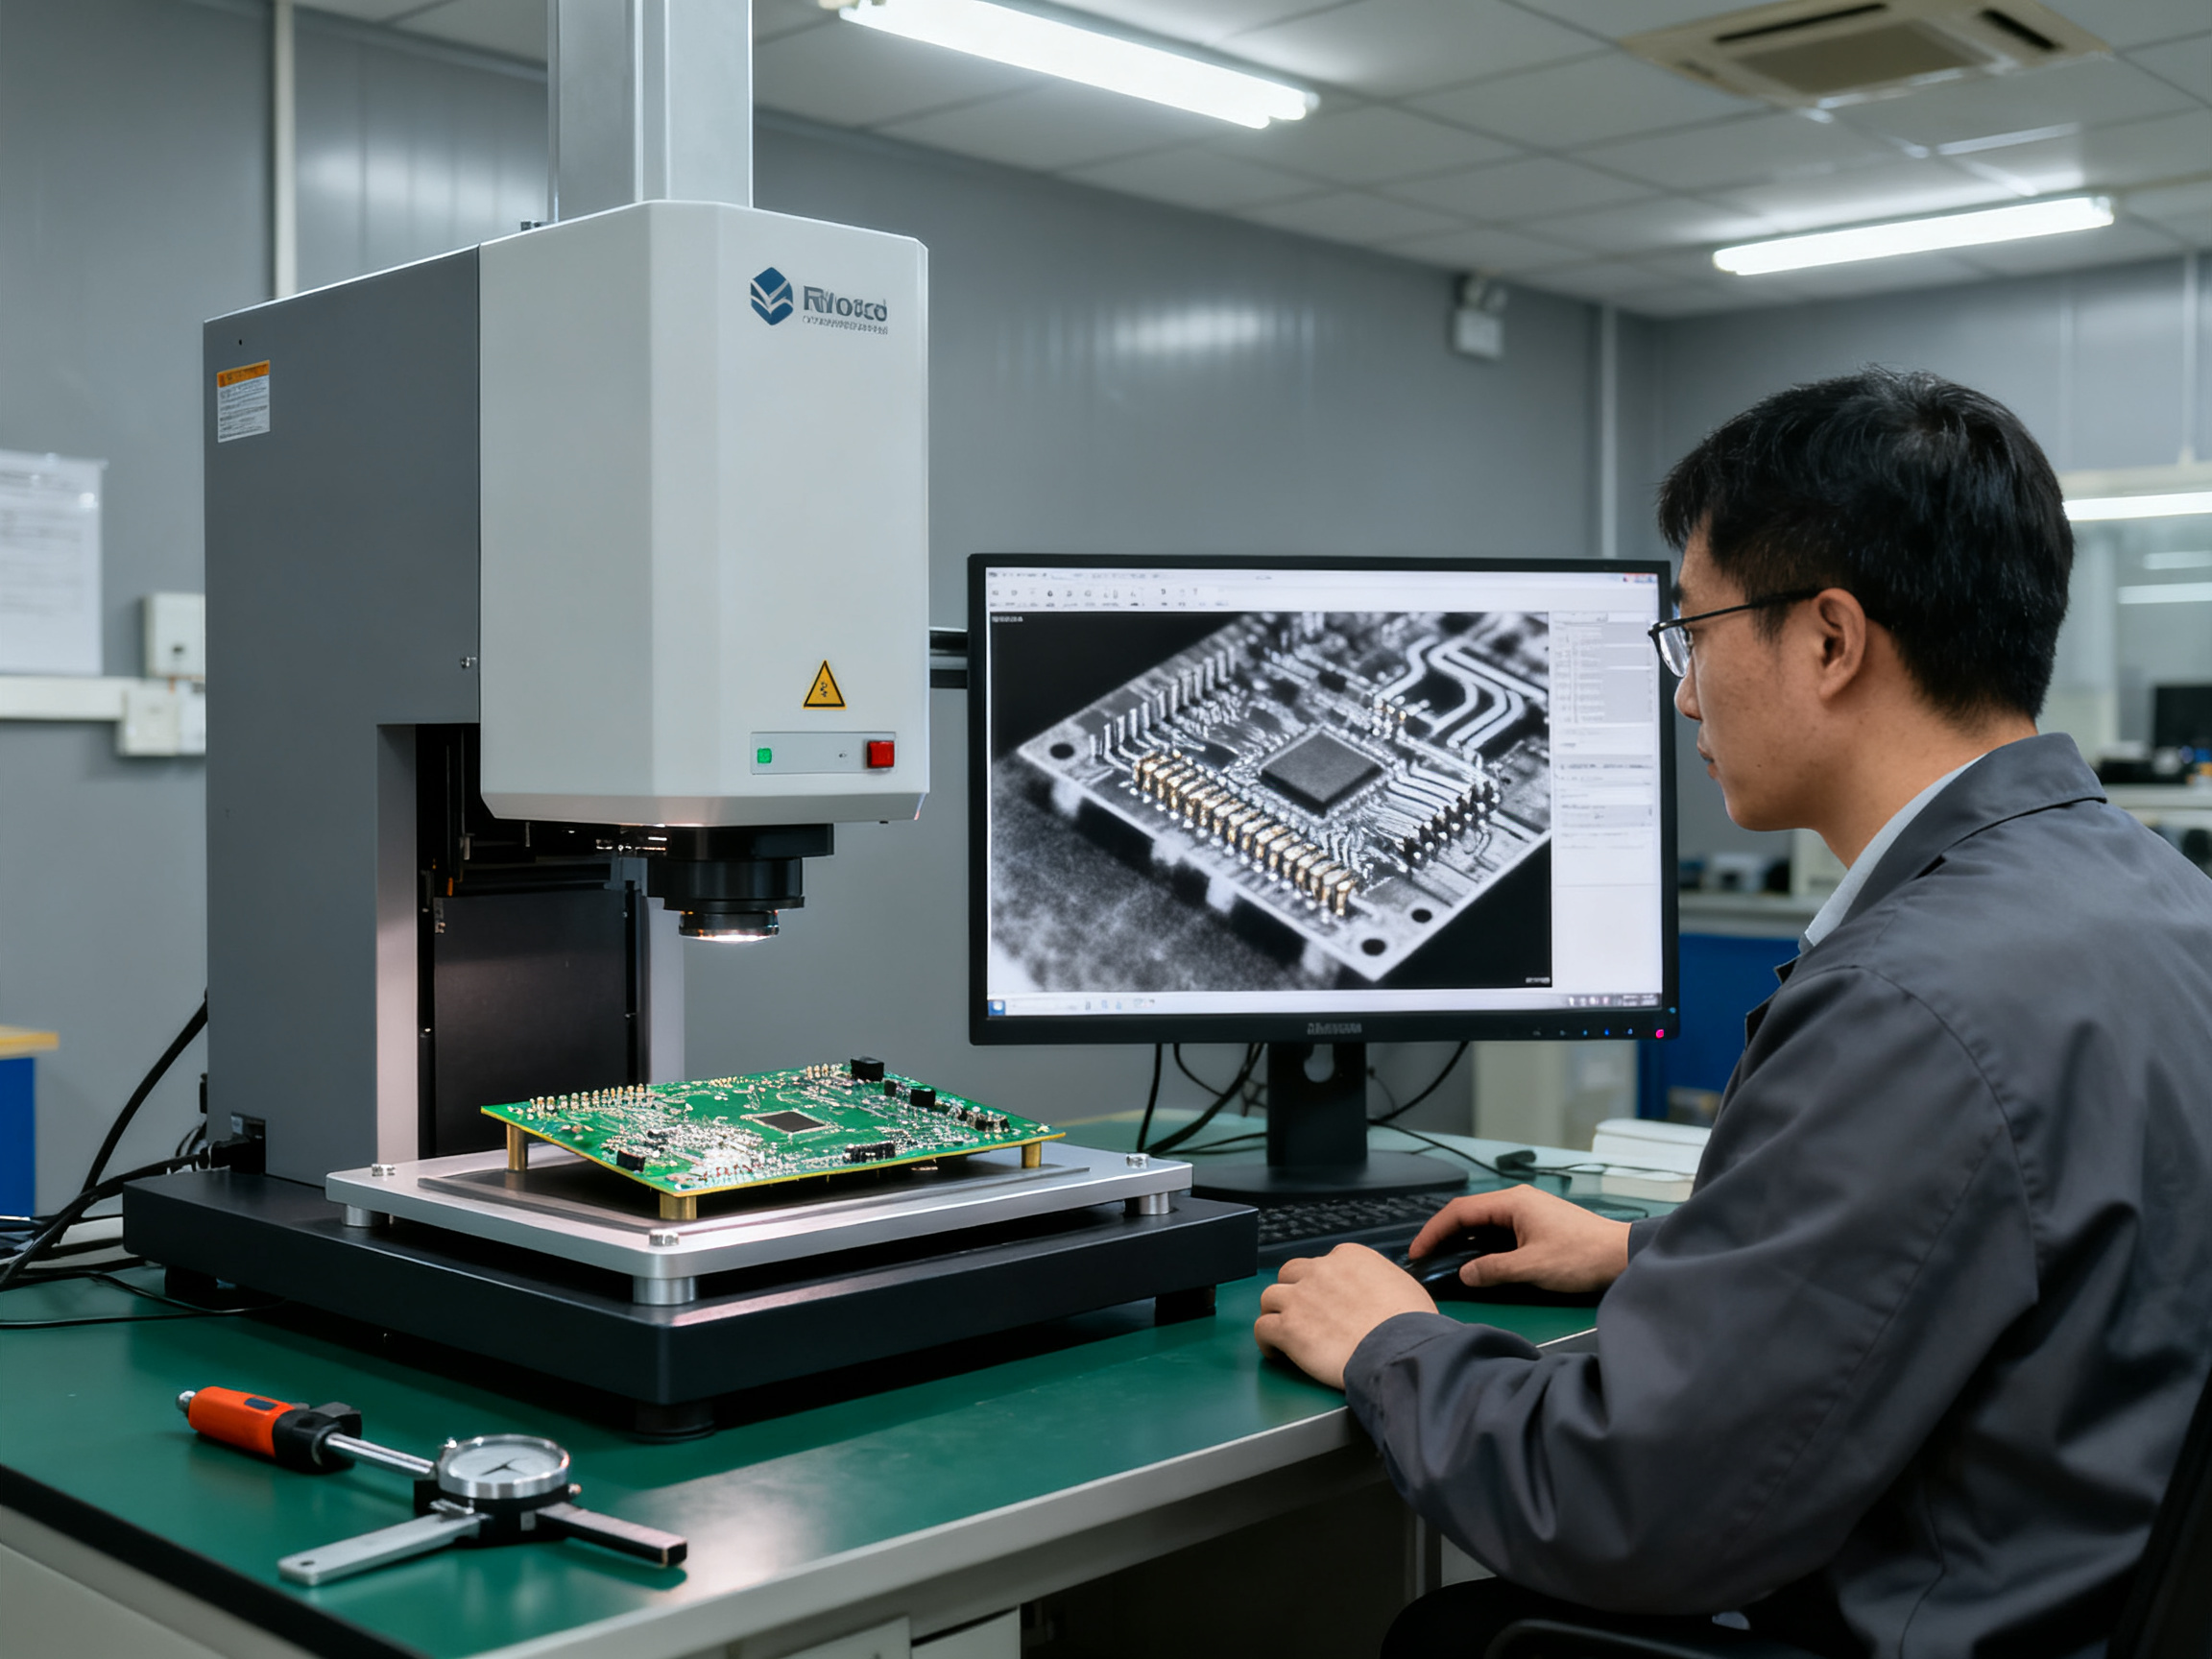
Defect Diagnosis Quick Reference
| Defect Type | Primary Root Cause | Profile Adjustment |
|————-|——————-|——————-|
| Cold joints | Peak temp too low, TAL too short | Increase peak 5-10°C or slow conveyor |
| Tombstoning | Uneven heating, ramp too fast | Reduce preheat ramp rate, extend soak |
| Solder bridging | Peak temp too high, TAL too long | Reduce peak 5°C or shorten conveyor time |
| BGA voids | Fast ramp through preheat zone | Slow to 1.0-1.5°C/s, extend soak |
| Head-in-pillow | Partial reflow, thermal lag | Increase TAL, check peak uniformity |
| Solder balls | Flux activation issues | Adjust preheat ramp, verify flux not exhausted |
| Neck fracture | Cooling rate too fast | Reduce cooling slope, add gradual cool |
| Dewetting | Oxidation, insufficient temperature | Verify peak and clean board surfaces |
The Profile vs. Non-Profile Test
Here’s a diagnostic trick that separates profile problems from other issues. Run the same profile with different paste lots. If defects follow the paste, your problem is material quality. If defects stay consistent regardless of paste, your profile is the culprit.
Similarly, rotate which board locations show defects. If failures cluster in the same thermal zones every time, the oven profile needs adjustment. Random distribution across boards usually means placement variation or component quality issues instead.
Modern profilers with AI-assisted analysis can spot drift patterns before they create defects. Systems like those from KIC now flag temperature deviations that would have gone unnoticed in older data review methods. For high-mix production environments, this predictive capability is worth the investment. You catch problems on test boards instead of production runs.
When you do find profile issues, document everything. What changed since the last good run? New board design? Different component lot? Conveyor belt replaced? Maintenance on the oven? The answer is usually in the change, not in the profile itself.
Conclusion: Expert Recommendations for Peak Reflow Profile Performance
Let’s bring this all together. Your reflow profile isn’t just a recipe. It’s the backbone of everything that happens on your SMT line. Get it right and your defect rates drop, your rework costs shrink, and your production schedules actually mean something. Get it wrong and you’re chasing problems that trace straight back to zone temperatures and conveyor speeds.
Here’s what the data tells us after years of working with manufacturers across different industries. Accurate thermal profiling can reduce solder joint defects by 40-60% by optimizing preheat, soak, reflow, and cooling phases. A temperature deviation of more than 5 degrees Celsius across reflow oven zones is often enough to trigger recalibration. Those numbers are real, and they translate directly to your bottom line.
The good news is that reflow profiling has never been more accessible. Modern profilers from KIC and others now include AI-assisted analysis that spots drift patterns before they become defects. Advanced reflow ovens like those from S&M Co. Ltd. offer closed-loop profile control that maintains thermal uniformity automatically. These tools take a lot of the guesswork out of the process.
Reflow Profile Best Practices Checklist
| Profile Stage | Target Parameter | What to Verify | Frequency |
|————–|—————–|—————-|————|
| Preheat | 1-3°C/s ramp rate | Flux activation, no thermal shock | Every profile |
| Soak | 150-200°C, 60-120s | Temperature equalization across board | Every profile |
| Ramp to Peak | 2-3°C/s ramp rate | Controlled transition, no overshoot | Every profile |
| Reflow Peak | 240-250°C for SAC305 | TAL 60-90s, wetting complete | Every profile |
| Cooling | 2-4°C/s descent rate | Controlled solidification, no warping | Every profile |
| Profile Verification | Cpk ≥ 1.33 target | Peak temp, TAL, ΔT across board | Weekly |
| Equipment Calibration | Thermocouple calibration | Traceable to standards | Every 6 months |
Profile Optimization Roadmap
| Priority | Action Item | Expected Impact | Timeline |
|———-|————-|——————|———-|
| High | Map thermal delta-T across your board | Identify hottest and coldest spots | This week |
| High | Verify thermocouple calibration | Eliminate measurement errors | Before next run |
| Medium | Establish baseline profile with data | Create reference for future comparison | This month |
| Medium | Implement weekly verification routine | Catch drift before defects occur | Ongoing |
| Medium | Train production staff on profile parameters | Reduce operator-induced variation | Next quarter |
| Low | Evaluate AI-assisted profiling tools | Predictive maintenance capability | Planning phase |
| Low | Upgrade to closed-loop profile control | Automated thermal uniformity | Capital review |
Ready to Optimize Your Reflow Process?
The path to reliable solder joints starts with understanding your current profile. Measure what you’re running now. Compare it against paste datasheet requirements and component MSL limits. Identify gaps and adjust systematically.
If you’re looking for equipment that supports tight process control, S&M Co. Ltd. manufactures lead-free reflow ovens designed for high-volume electronic assembly. Their systems emphasize thermal uniformity and profile repeatability, which matters when you’re trying to hit those narrow lead-free process windows.
For help with your specific board configuration or profile development, reach out to a thermal profiling specialist who can review your setup and recommend targeted improvements.
Jace Liu is a technical specialist in SMT manufacturing processes and reflow soldering technology with extensive hands-on experience optimizing thermal profiles for high-density electronic assemblies.
Expert Recommendations for Peak Reflow Profile Performance: Consistent profile optimization requires systematic measurement, documentation, and continuous improvement practices. Investing in modern profiling equipment and training delivers measurable ROI through defect reduction and yield improvement. Collaboration between process engineering, production, and equipment vendors enables best-in-class reflow outcomes.