



Veröffentlicht: 28 August 2026
Lesezeit: 15 Minuten
Rezensent: Not specified
Picture this. You’ve got your SMT line humming along nicely. The pick-and-place machine is flying through components. Your reflow oven is hitting temps perfectly. Everything looks great on paper.
But then you check the output numbers and something feels off. Boards are piling up somewhere. Operators are waiting around with nothing to do. And that shiny new equipment you bought to speed things up? It’s sitting idle half the time.
Sound familiar?
Here’s the thing about modern SMT lines: they’re not just collections of machines bolted together. They’re ecosystems where every piece of equipment has to dance in sync. When one station runs faster or slower than the others, the whole show falls apart. Those speed mismatches between equipment create what engineers call bottlenecks, and bottlenecks are basically money flying out the window.
We’re talking about idle time, reduced equipment effectiveness, and production schedules that slip day after day. The research shows that manual board handling and transfers between stations can eat up 18 to 25 percent of your total line cycle time. That’s huge when you think about it. And it’s usually the last thing manufacturers notice because the problem hides in plain sight.
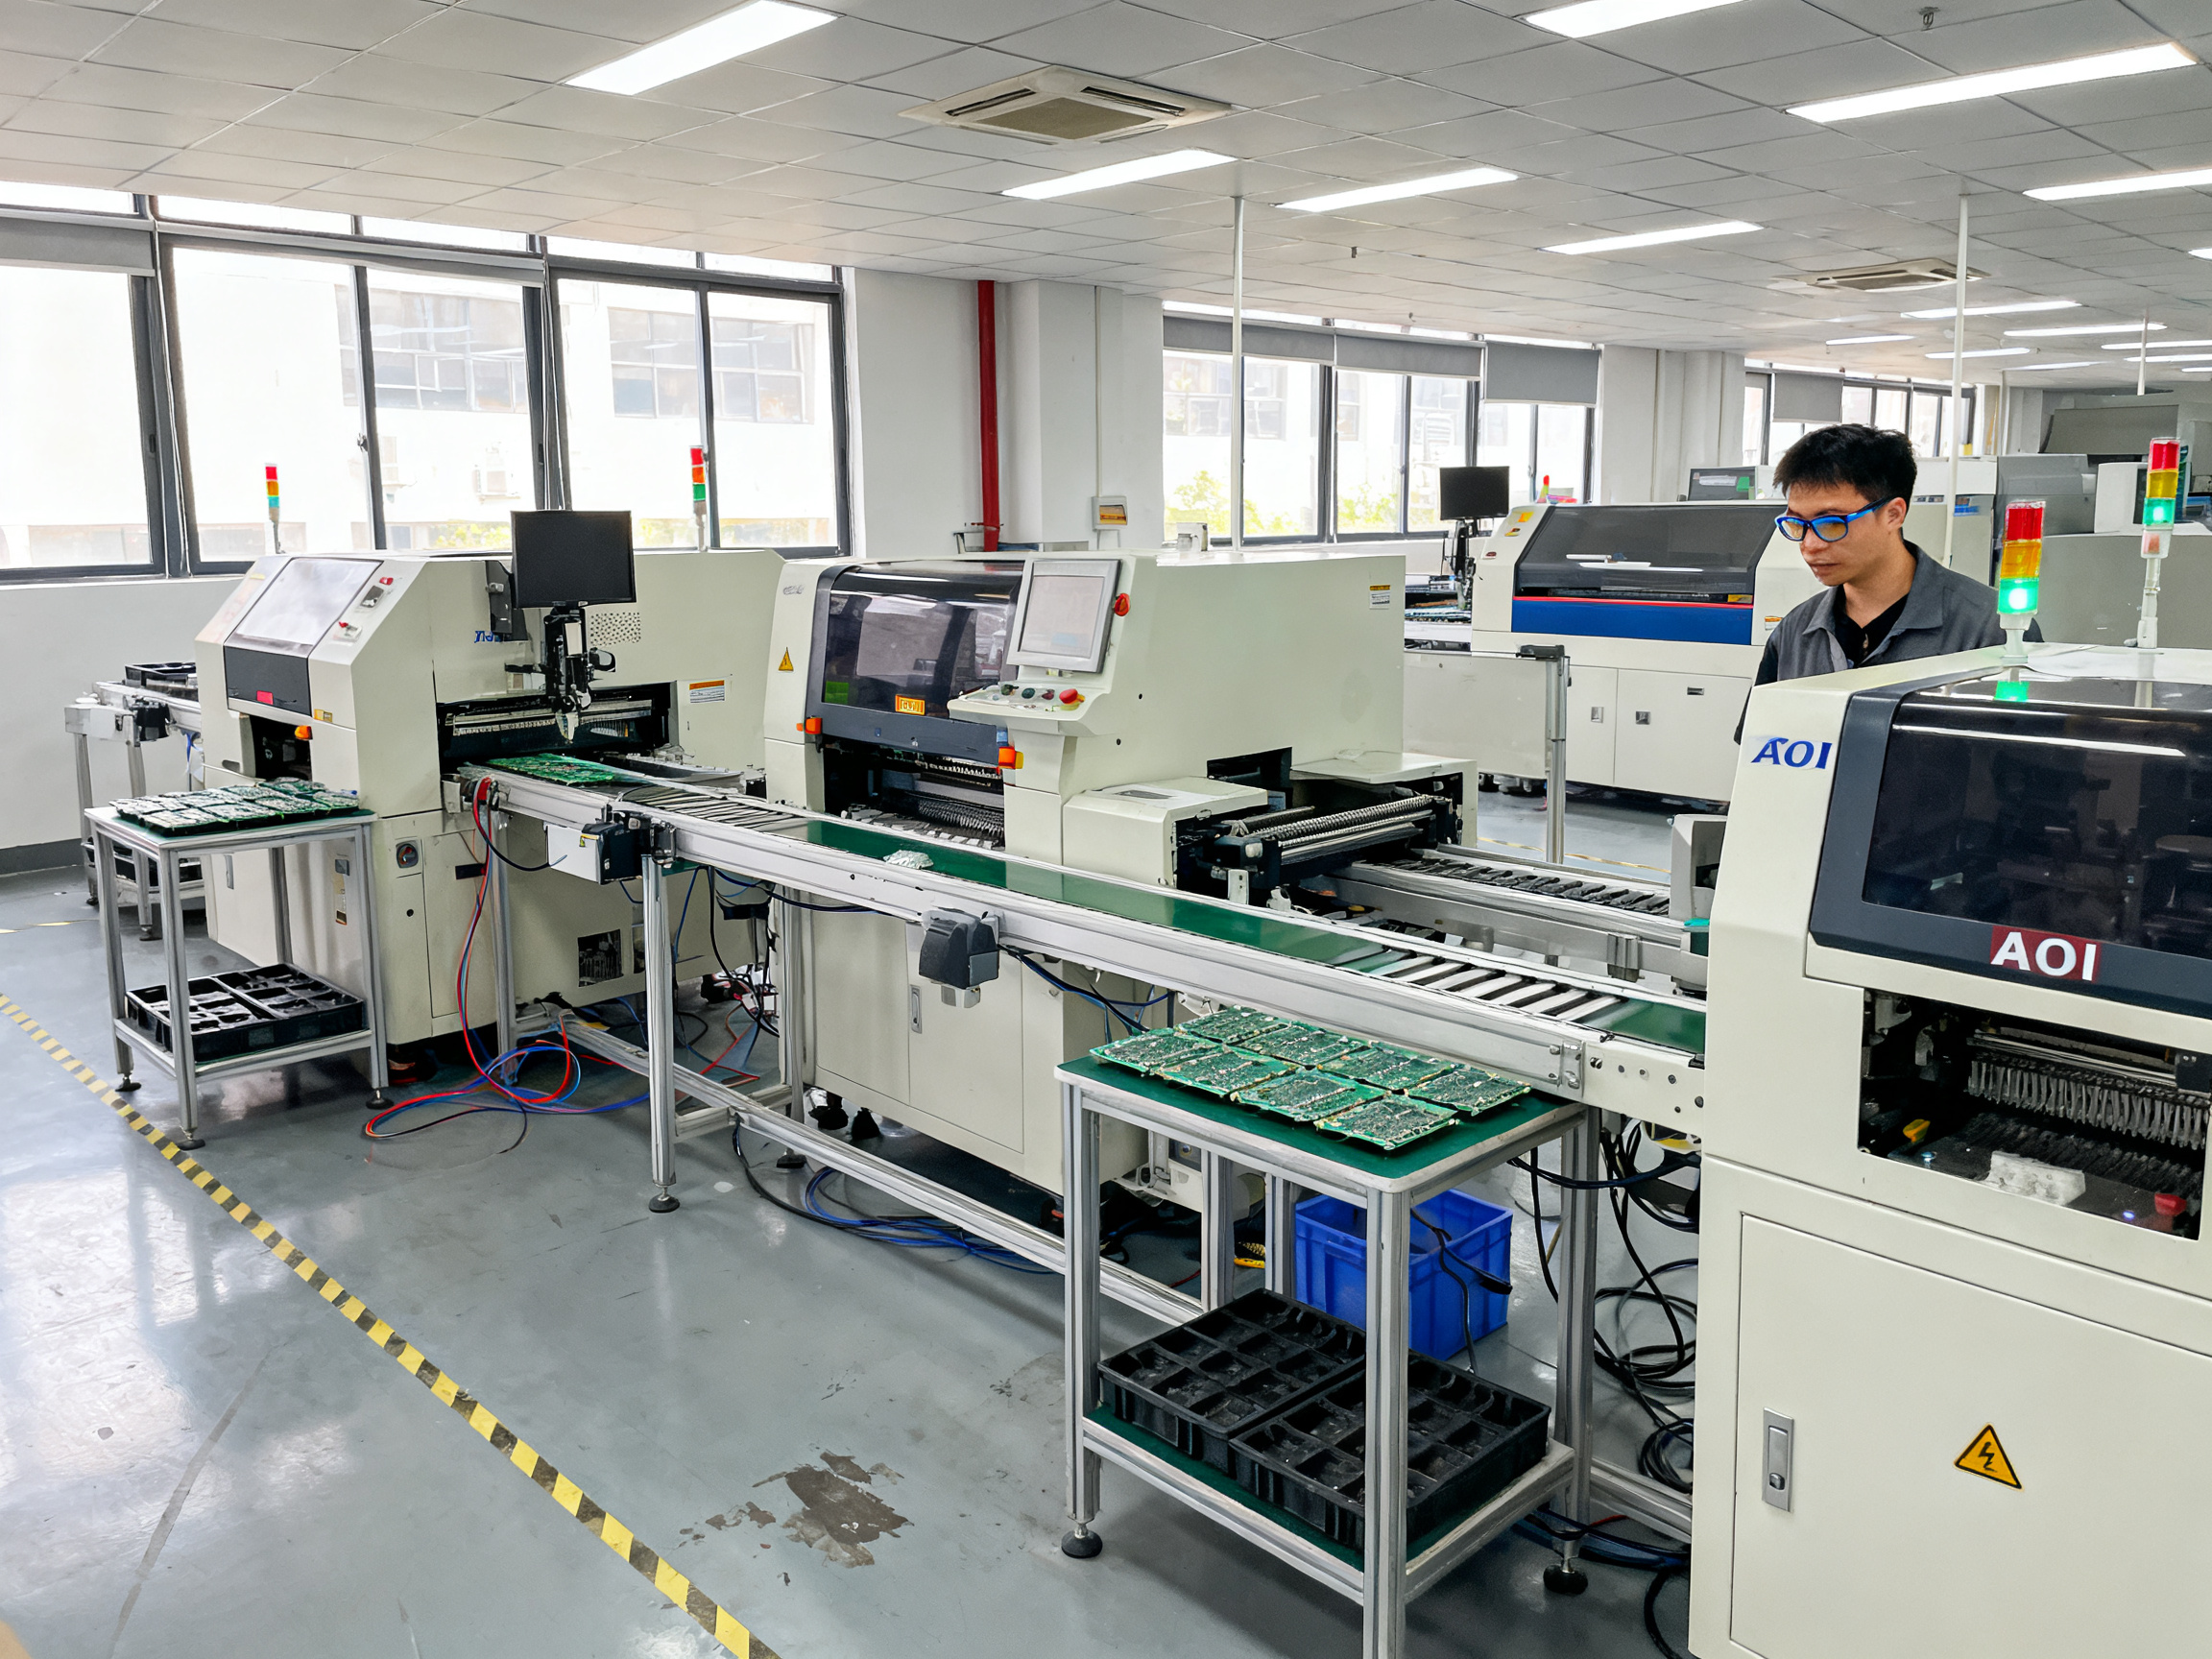
This guide walks you through everything you need to know about SMT line speed matching. We’ll cover how to calculate cycle times for each process step, spot bottlenecks before they become disasters, and actually fix the imbalances holding your line back. By the end, you’ll have a clear framework for boosting throughput without creating new headaches along the way.
Let’s get into it.
The basic SMT production flow moves boards through stencil printing, component placement, reflow soldering, and automated optical inspection. Each stage must sync with the others for maximum throughput.
Jace Liu brings over a decade of hands-on experience optimizing SMT production lines. As an SMT process specialist and overseas market representative at Shenzhen Chuxin Electronic Equipment Co., Ltd., he has worked extensively with reflow ovens, pick-and-place systems, and full-line integration projects across Asia and North America. His practical approach to line balancing and throughput optimization comes from real factory floors, not just theory.
About the Author: Jace Liu, SMT Process Specialist
Jace Liu works as an SMT process specialist and overseas market representative at Shenzhen Chuxin Electronic Equipment Co., Ltd., a company specializing in surface mount technology equipment including reflow ovens, wave soldering systems, and complete production lines.
His day-to-day work involves helping manufacturers optimize line configurations, troubleshoot reflow profiling issues, and reduce defect rates in high-density PCB assemblies. He has worked on integration projects spanning Asia and North America, which gives him exposure to different production environments and common bottlenecks that affect throughput across varied setups.
Jace regularly writes about reflow oven optimization, line balancing strategies, and practical approaches to SMT efficiency improvements. His focus is on translating complex process engineering concepts into actionable guidance that manufacturing teams can apply directly on the shop floor.
When not working with SMT equipment, he consults on production line commissioning and helps manufacturers evaluate equipment upgrades for lead-free soldering compliance.
Understanding SMT Line Speed Matching: The Foundation
SMT line speed matching is the process of synchronizing how fast each piece of equipment on your production line runs. Think of it like an assembly line of dancers. Everyone has to move at the same pace or someone trips over their partner. In manufacturing, that trip is a bottleneck, and bottlenecks cost you money every single minute they exist.
The core idea is simple. Every machine on your SMT line has a natural speed. Your stencil printer might print 45 boards per minute. Your pick-and-place might place components at 60 boards per minute. Your reflow oven might handle 50 boards per minute. See the problem? Your printer is the slowest link, so your entire line maxes out at 45 boards per minute. That gap between your placer’s potential and your line’s actual output is wasted capacity, and it adds up fast.
The goal of speed matching is to balance all your stations so they work together smoothly. You want no single machine running way ahead or way behind the others. When everything clicks, boards flow continuously from one station to the next without piling up or leaving gaps. That steady flow is where your real throughput lives.
Why does this matter for your bottom line? Mature SMT lines targeting strong performance aim for 75 to 85 percent overall equipment effectiveness. Some top-tier operations push past 85 percent on well-balanced lines. But here’s the kicker: research shows that manual board handling and transfers between stations can eat up 18 to 25 percent of your total line cycle time. That’s a massive chunk of lost productivity, and it’s usually hiding in plain sight between equipment. When you match your line speeds properly, you’re not just making machines run. You’re reclaiming that lost time and turning it into actual output.
Speed matching directly impacts your operating expenses too. When your line runs efficiently, you spread labor costs across more units. Defects drop because boards aren’t sitting around waiting for the next process. And your equipment does what it was built to do instead of idling or being overworked.
Let’s break down the key terms you’ll see throughout this guide.
Key Definitions
| Term | What It Means |
|——|—————|
| Zykluszeit | The time it takes a single machine to complete its portion of one board |
| Takt Time | The maximum time allowed per unit to meet customer demand; your target pace |
| Line Rate | Your actual finished boards per hour across the entire line |
| Bottleneck | The station with the longest cycle time that limits how fast your whole line can run |
Here’s the thing though. Your bottleneck isn’t always the machine with the highest speed rating on paper. It’s the station where boards start stacking up, where operators have to wait, or where your planned output keeps falling short. Sometimes it’s the printer. Sometimes it’s the inspection station. Sometimes it’s a feeder jam that nobody noticed. Finding your real bottleneck is the first step to fixing it.
So now you know what speed matching is and why it matters. Next, let’s look at how to actually measure what your line is doing.
Calculating Cycle Times for Each SMT Process Step
Now we get to the math part. Don’t worry, I’ll keep it simple. To fix your line speeds, you first need to know what those speeds actually are. That means measuring cycle time for every station.
Here’s how each piece of equipment talks:
Stencil Printers measure in boards per hour. A typical high-speed printer handles 45 to 60 boards per minute depending on board size and paste type. The cycle time here is straightforward: how fast does the board go in and come out?
Pick-and-place machines are rated in CPH (components per hour). Modern machines in 2026 typically hit 80,000 to 150,000 CPH at the top end. But here’s the catch: that number is for simple, identical parts. Add fine-pitch components or mixed board sizes, and that number drops fast. One source I saw mentioned realistic output of 50,000 to 70,000 CPH for mixed production. Always plan for reality, not the marketing brochure.
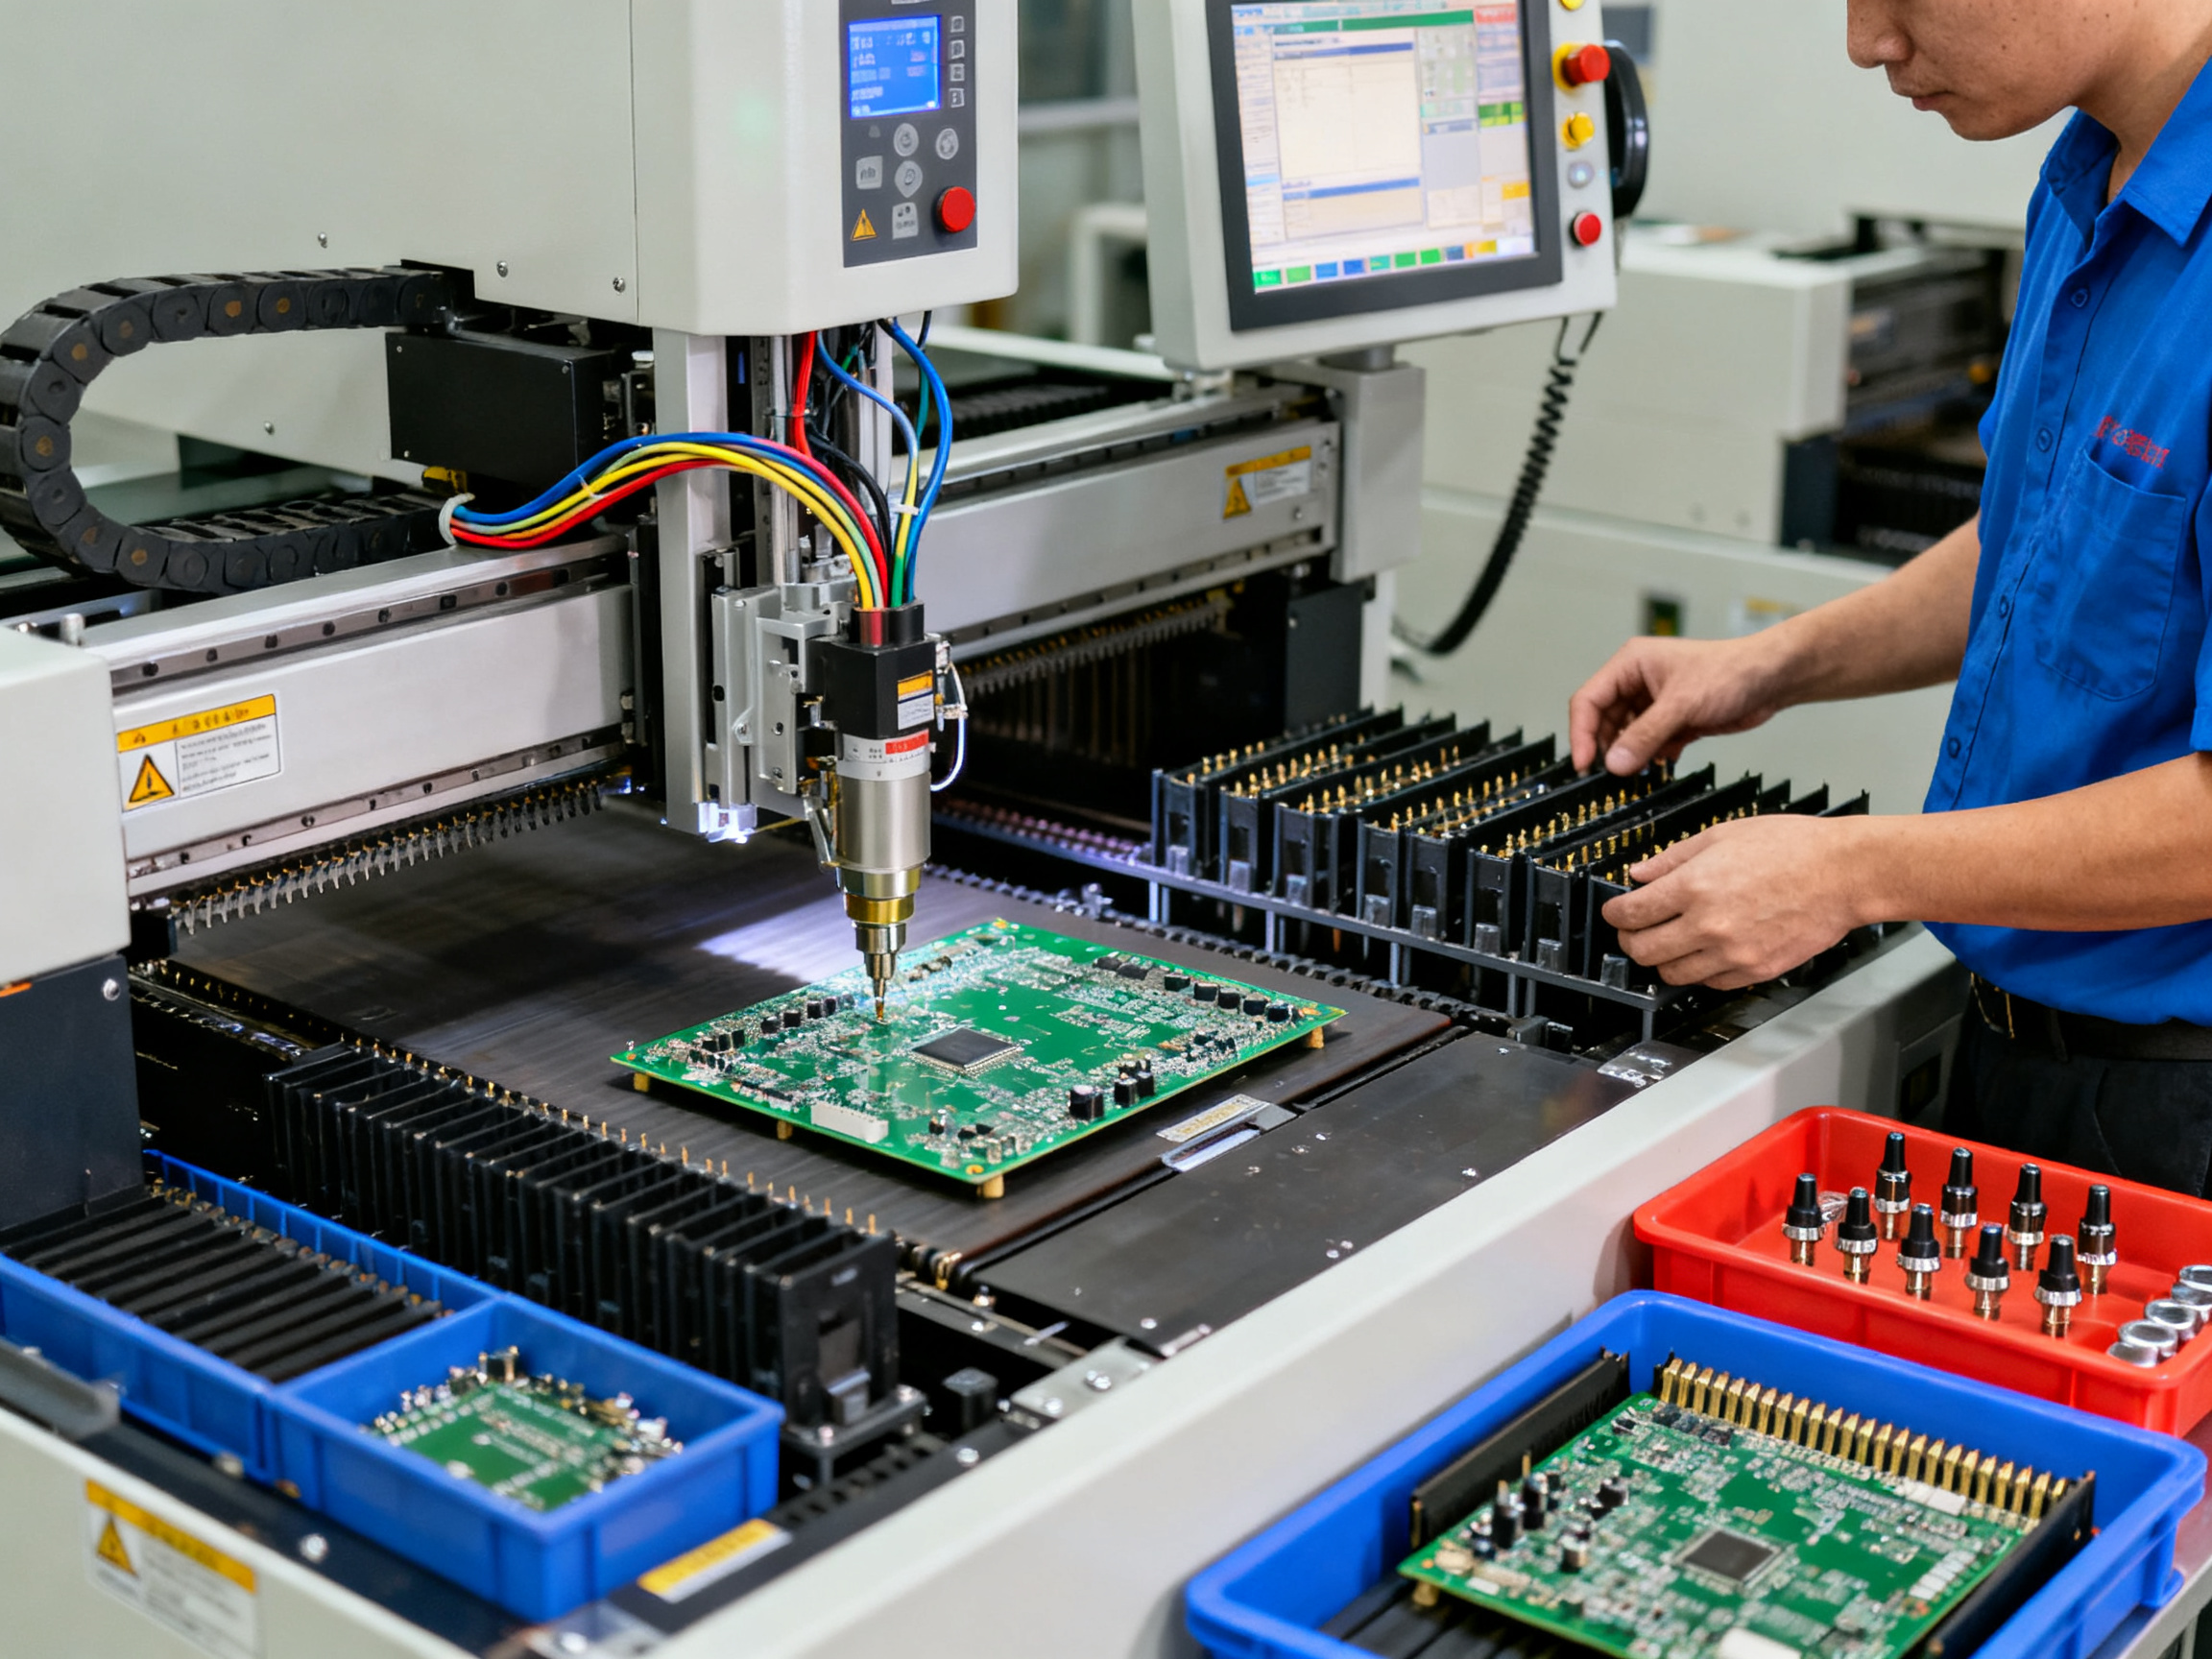
Reflow ovens are a bit different. They don’t have a simple boards-per-hour rating. Instead, you look at conveyor speed, number of zones, and the thermal profile each board needs. A typical lead-free profile takes 4 to 7 minutes end to end. The oven’s physical belt speed tells you its throughput potential.
AOI and Inspection Stations go by boards per hour again. These depend on how complex your inspection criteria are and what resolution you’re running.
Here’s a quick reference for typical ranges:
| Equipment Type | Typical Cycle Time Metric | 2026 Benchmark Range |
|—————-|—————————|———————|
| Stencil Printer | Boards per minute | 40 to 60 bpm |
| Pick-and-Place | Components per hour (CPH) | 80,000 to 150,000 CPH |
| Reflow Oven | Conveyor speed (mm/min) | Varies by zone count |
| AOI Inspection | Boards per hour | 200 to 600 bph |
Now here’s the key formula you’ll use:
Maximum Line Throughput = 3600 ÷ Bottleneck Cycle Time (seconds) × Yield Rate
Let me break that down. If your bottleneck is a stencil printer running 1.2 seconds per board, you do this: 3600 divided by 1.2 equals 3000. Multiply by your first-pass yield rate of 0.98, and you get 2940 good boards per hour.
That’s your theoretical maximum. Real-world factors like changeover time, maintenance stops, and operator breaks will bring that number down.
Pro Insight: Industry benchmarks show that mature SMT lines in 2026 are targeting 75 to 85 percent overall equipment effectiveness, with some top-tier operations pushing past 85 percent on well-balanced lines. The difference between 70 and 85 percent OEE often comes down to how closely your station speeds are matched and how little time boards spend waiting between steps.
The takt time concept fits in here too. Takt time is your target pace based on customer demand. If you need to ship 3000 boards per shift and you have 8 hours, your takt time is 9.6 seconds per board. Every station needs to hit 9.6 seconds or better. When a station can’t keep up, that’s your signal to investigate.
Once you have these numbers, the real work begins. You start seeing exactly where your line bleeds time and which station is holding everything back.
Identifying and Resolving Bottlenecks in Your SMT Line
Alright, so you know what speed matching is. You know how to measure cycle times. But how do you actually find the thing that’s holding your line back?
Here’s the honest truth: most bottlenecks hide in plain sight. The printer looks fast on paper. The placer has a great spec sheet. But somewhere in the middle, boards start stacking up and nobody notices until production falls behind schedule.
How to Find Your Real Bottleneck
Finding bottlenecks takes more than reading spec sheets. You’ve got to watch your line during actual production and look for patterns.
The main ways to identify bottlenecks:
Time studies: Stand at each station with a stopwatch. Time how long boards actually sit there. Compare the numbers to what you expect.
OEE analysis: Track overall equipment effectiveness across your line. Look for which stations have the lowest availability, performance, or quality scores.
WIP monitoring: Watch where boards pile up. If inventory keeps growing between two stations, the downstream station is probably your bottleneck.
Production data analytics: Modern SMT analytics platforms in 2026 can automatically flag throughput-limiting steps. ASMPT’s line balance analysis, for example, compares actual station cycle times against reference values to reveal where your line is choking.
Common Bottleneck Locations
In my experience, certain stations cause problems more often than others.
The pick-and-place machine is the usual suspect. Older heads, worn nozzles, or limited feeder capacity can turn a supposedly fast machine into a bottleneck. Single-lane reflow ovens also create issues, especially when multiple printers feed into one oven. Inspection stations sometimes become constraints when staffing is tight or when your AOI system runs slower than your placement line.
And sometimes, it is the printer after all. One source I saw pointed out that printers become bottlenecks in many lines because their actual throughput falls below the placers feeding them.
Tipp vom Experten: Warning signs that indicate your SMT line is approaching throughput limitations before they become critical problems include: operators mentioning that one station “always backs up,” frequent feeder jams or nozzle changes at a specific machine, and output numbers that drift lower as a shift progresses. Catching these early gives you time to plan solutions instead of scrambling during a crisis.
How to Fix Bottlenecks
Once you find your bottleneck, you have a few options:
Equipment upgrades: Sometimes a machine genuinely cannot keep up with your takt time. Upgrading makes sense here.
Parallel processing: Split the workload across two stations or add a buffer to decouple fast and slow sections.
Runtime optimization: Adjust machine settings, changeover procedures, or feeder configurations to squeeze more speed from existing equipment.
Workload redistribution: Balance work across your line instead of upgrading one machine.
Here’s something I saw happen at a factory. A manufacturer had a pick-and-place machine rated at 80,000 CPH that kept becoming the bottleneck. After investigation, it turned out the machine was fine. The real issue was a feeder configuration problem that caused frequent jams and slow component changes. Once they optimized the feeder arrangement and placement sequence, the machine delivered 70,000+ CPH consistently. No hardware upgrade needed.
The lesson here: always verify where the actual constraint sits before spending money on equipment. The bottleneck is not always where you think it is.
This flowchart shows the bottleneck diagnosis cycle: measure each station, compare against takt time, identify the constraint, implement a fix, then monitor results and repeat.
Once you fix one bottleneck, the next-slowest station becomes your new constraint. Speed matching is an ongoing process, not a one-time fix. Your line will evolve as products change, equipment ages, and demand shifts.
Balancing Throughput Across Equipment Stages
Alright, so you have your numbers. You know where the bottlenecks are. Now comes the part where things actually get better: line balancing.
Line balancing means adjusting individual machine speeds and parameters to achieve a smooth, even flow across your entire SMT line. Think of it like tuning an orchestra. Every instrument can play loudly on its own, but if they’re not in sync, the result is chaos instead of music.
Here’s what we mean by that. Your pick-and-place machine might be capable of screaming along at 100,000 CPH. But if your stencil printer only handles 45 boards per minute, cranking up the placer just means more boards pile up in front of the printer. You’ve got faster machines waiting on slower ones. That’s not optimization, that’s just expensive idling.
The key balancing techniques we use involve placement head speeds, reflow profile parameters, and inspection sampling rates. On the placement side, adjusting head speeds for different component types makes a big difference. You can run fast on standard passives, then slow down for fine-pitch ICs and BGAs. The trick is matching that speed to the actual complexity on each board instead of running everything at one pace.
Reflow oven balancing works differently. You can’t just change the belt speed without thinking about thermal profiles. But you can optimize your zone temperatures and conveyor settings to match what each product needs. That way you get consistent throughput without creating solder defects.
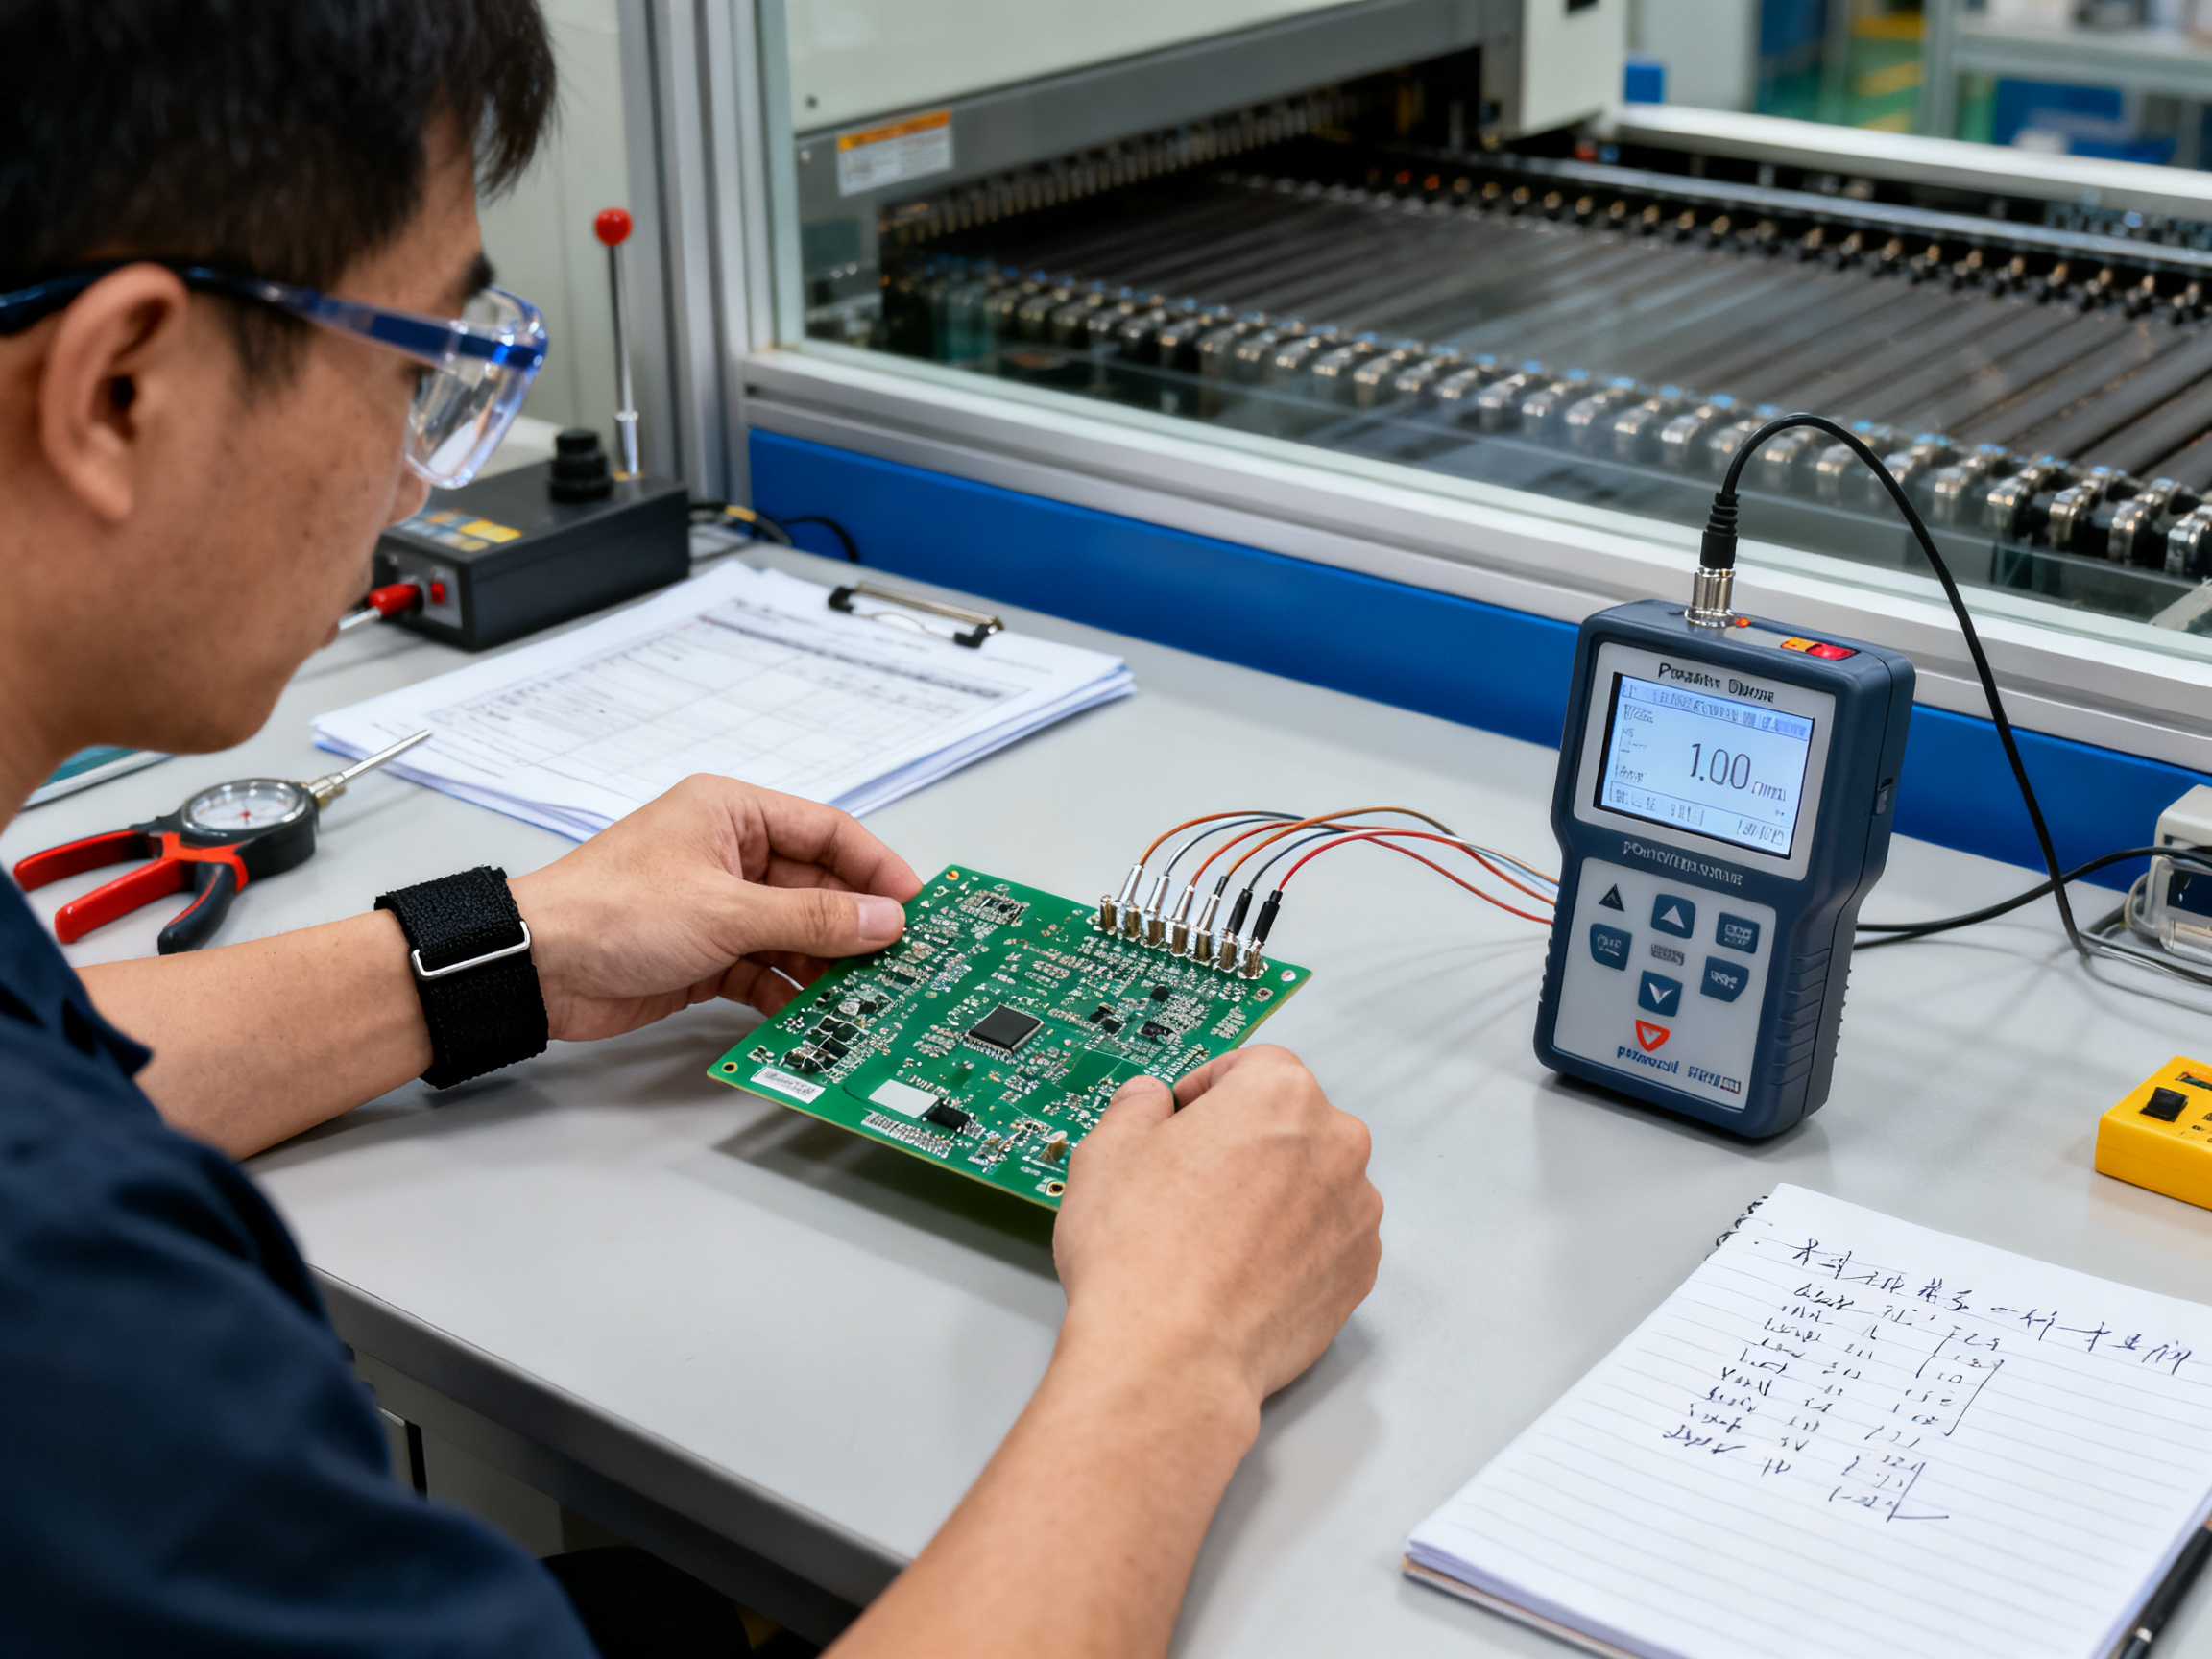
Inspection station sampling rates matter too. Running every board through full high-resolution inspection sounds thorough, but it might not be necessary for simple products. A risk-based sampling approach lets you focus detailed inspection where it counts most.
Here’s the critical piece though: balancing has to consider quality implications. Push speeds too far and your defect rate climbs. Suddenly you’re making more boards, but more of them are scrap. The rework costs eat up whatever throughput gains you thought you had.
Balanced vs. Unbalanced Line Performance
| Metric | Unbalanced Line | Balanced Line |
|——–|—————–|—————-|
| Station cycle time variance | 30 to 50 percent difference | Within 10 percent of each other |
| Manual handling losses | 18 to 25 percent of cycle time | Under 3 percent with buffers |
| Typical line efficiency | 52 percent average | 75 to 85 percent target |
| WIP inventory | High, variable buildup | Steady, predictable flow |
The real target here is matching every station to your takt time. When each piece of equipment runs at or below the pace your customer demand requires, your line flows like water. No station runs way ahead, no station falls behind.
We always recommend tracking first-pass yield alongside throughput numbers during any balancing work. A balanced line that maintains 98 percent yield beats an unbalanced line running 85 percent yield, every single time. Quality and speed work together, not against each other.
Once your line is balanced, those throughput numbers become predictable. You can commit to delivery dates with confidence because your SMT line efficiency improvement shows up in actual finished boards, not just theoretical capacity.
Implementing Real-Time Speed Monitoring Systems
Picture this. Your SMT line looks fine on paper. The spec sheets check out. The numbers look good. But your actual output keeps falling short of targets day after day. Without real-time visibility, you’re flying blind. And that’s where monitoring systems come in.
Modern SMT lines benefit from real-time monitoring that tracks actual cycle times against targets and alerts operators to deviations before they snowball into bigger problems. Think of it as giving your entire production line a fitness tracker. Instead of waiting until something breaks down, you see the warning signs early.
What Monitoring Systems Actually Do
The core functions come down to three things: capture, compare, and alert.
Monitoring platforms capture data from every station on your line. Conveyor speeds, placement counts, reflow temperatures, inspection results. All of it flows into a central system that builds a live picture of what’s happening right now.
Then they compare that data against your targets. Is the stencil printer hitting 45 boards per minute or has it drifted to 42? Is the pick-and-place running at expected CPH or are feeder changes eating into throughput? The system flags anything outside acceptable ranges automatically.
Alerts go to operators and supervisors in real time. No more waiting until end-of-shift reports to discover something went wrong. When a station starts trending off-target, you know about it immediately.
Leading platforms in 2026 include ASMPT WORKS Monitoring, Mycronic MYPro Connect, and Panasonic PanaCIM. These systems pull data across stations and surface imbalances that would otherwise hide in spreadsheets or gut feelings.
MES Integration Takes It Further
Manufacturing Execution System integration provides visibility into line performance, enabling data-driven speed optimization decisions. When your monitoring system connects to your MES, you get context that standalone dashboards cannot provide.
Instead of just knowing a station ran slow, you know why. Was it a feeder jam? A changeover? A quality hold? You see the root cause alongside the symptom, which means faster fixes and better long-term decisions.
Open protocols like IPC-CFX make integration easier than it used to be. Most modern equipment supports these standards, so you can pull data without replacing everything you already have.
Predictive Analytics: Seeing Problems Before They Happen
Predictive analytics can forecast bottleneck formation based on historical patterns, allowing proactive intervention. This is where things get interesting.
When your system has enough run data, it starts recognizing patterns. Maybe a particular feeder shows increasing jam frequency over several shifts. Maybe your reflow oven thermal profile drifts gradually before causing defects. Predictive analytics flags these trends before they become critical failures.
One case study from IntelFactor showed a 7:1 ROI when monitoring data fed into systematic root-cause analysis. The savings came from catching problems early, reducing unplanned downtime, and making faster, better decisions about line adjustments.
Aus unserer Erfahrung: We implemented real-time monitoring across a customer’s dual-lane SMT line last year. Within the first week, they discovered their AOI station was running 15 percent slower than expected due to a camera resolution setting that was higher than necessary for their product mix. After adjusting the inspection parameters, throughput jumped immediately without any quality sacrifice. The monitoring system paid for itself in less than two months.
Getting Started Without Breaking the Bank
Here’s the honest truth though. Full MES integration with predictive analytics sounds great, but what if you run a smaller operation?
Start small. Pick one line or even one problem station. Focus on capturing machine state, downtime reasons, and basic cycle time data before trying to track everything at once.
Cloud-based monitoring solutions have dropped in cost significantly. You do not need a massive IT infrastructure to get started. Add stations and capabilities as you prove value and your budget allows.
The goal is not perfect visibility on day one. It is knowing more than you know right now. Even a little monitoring gives you a foundation to build on.
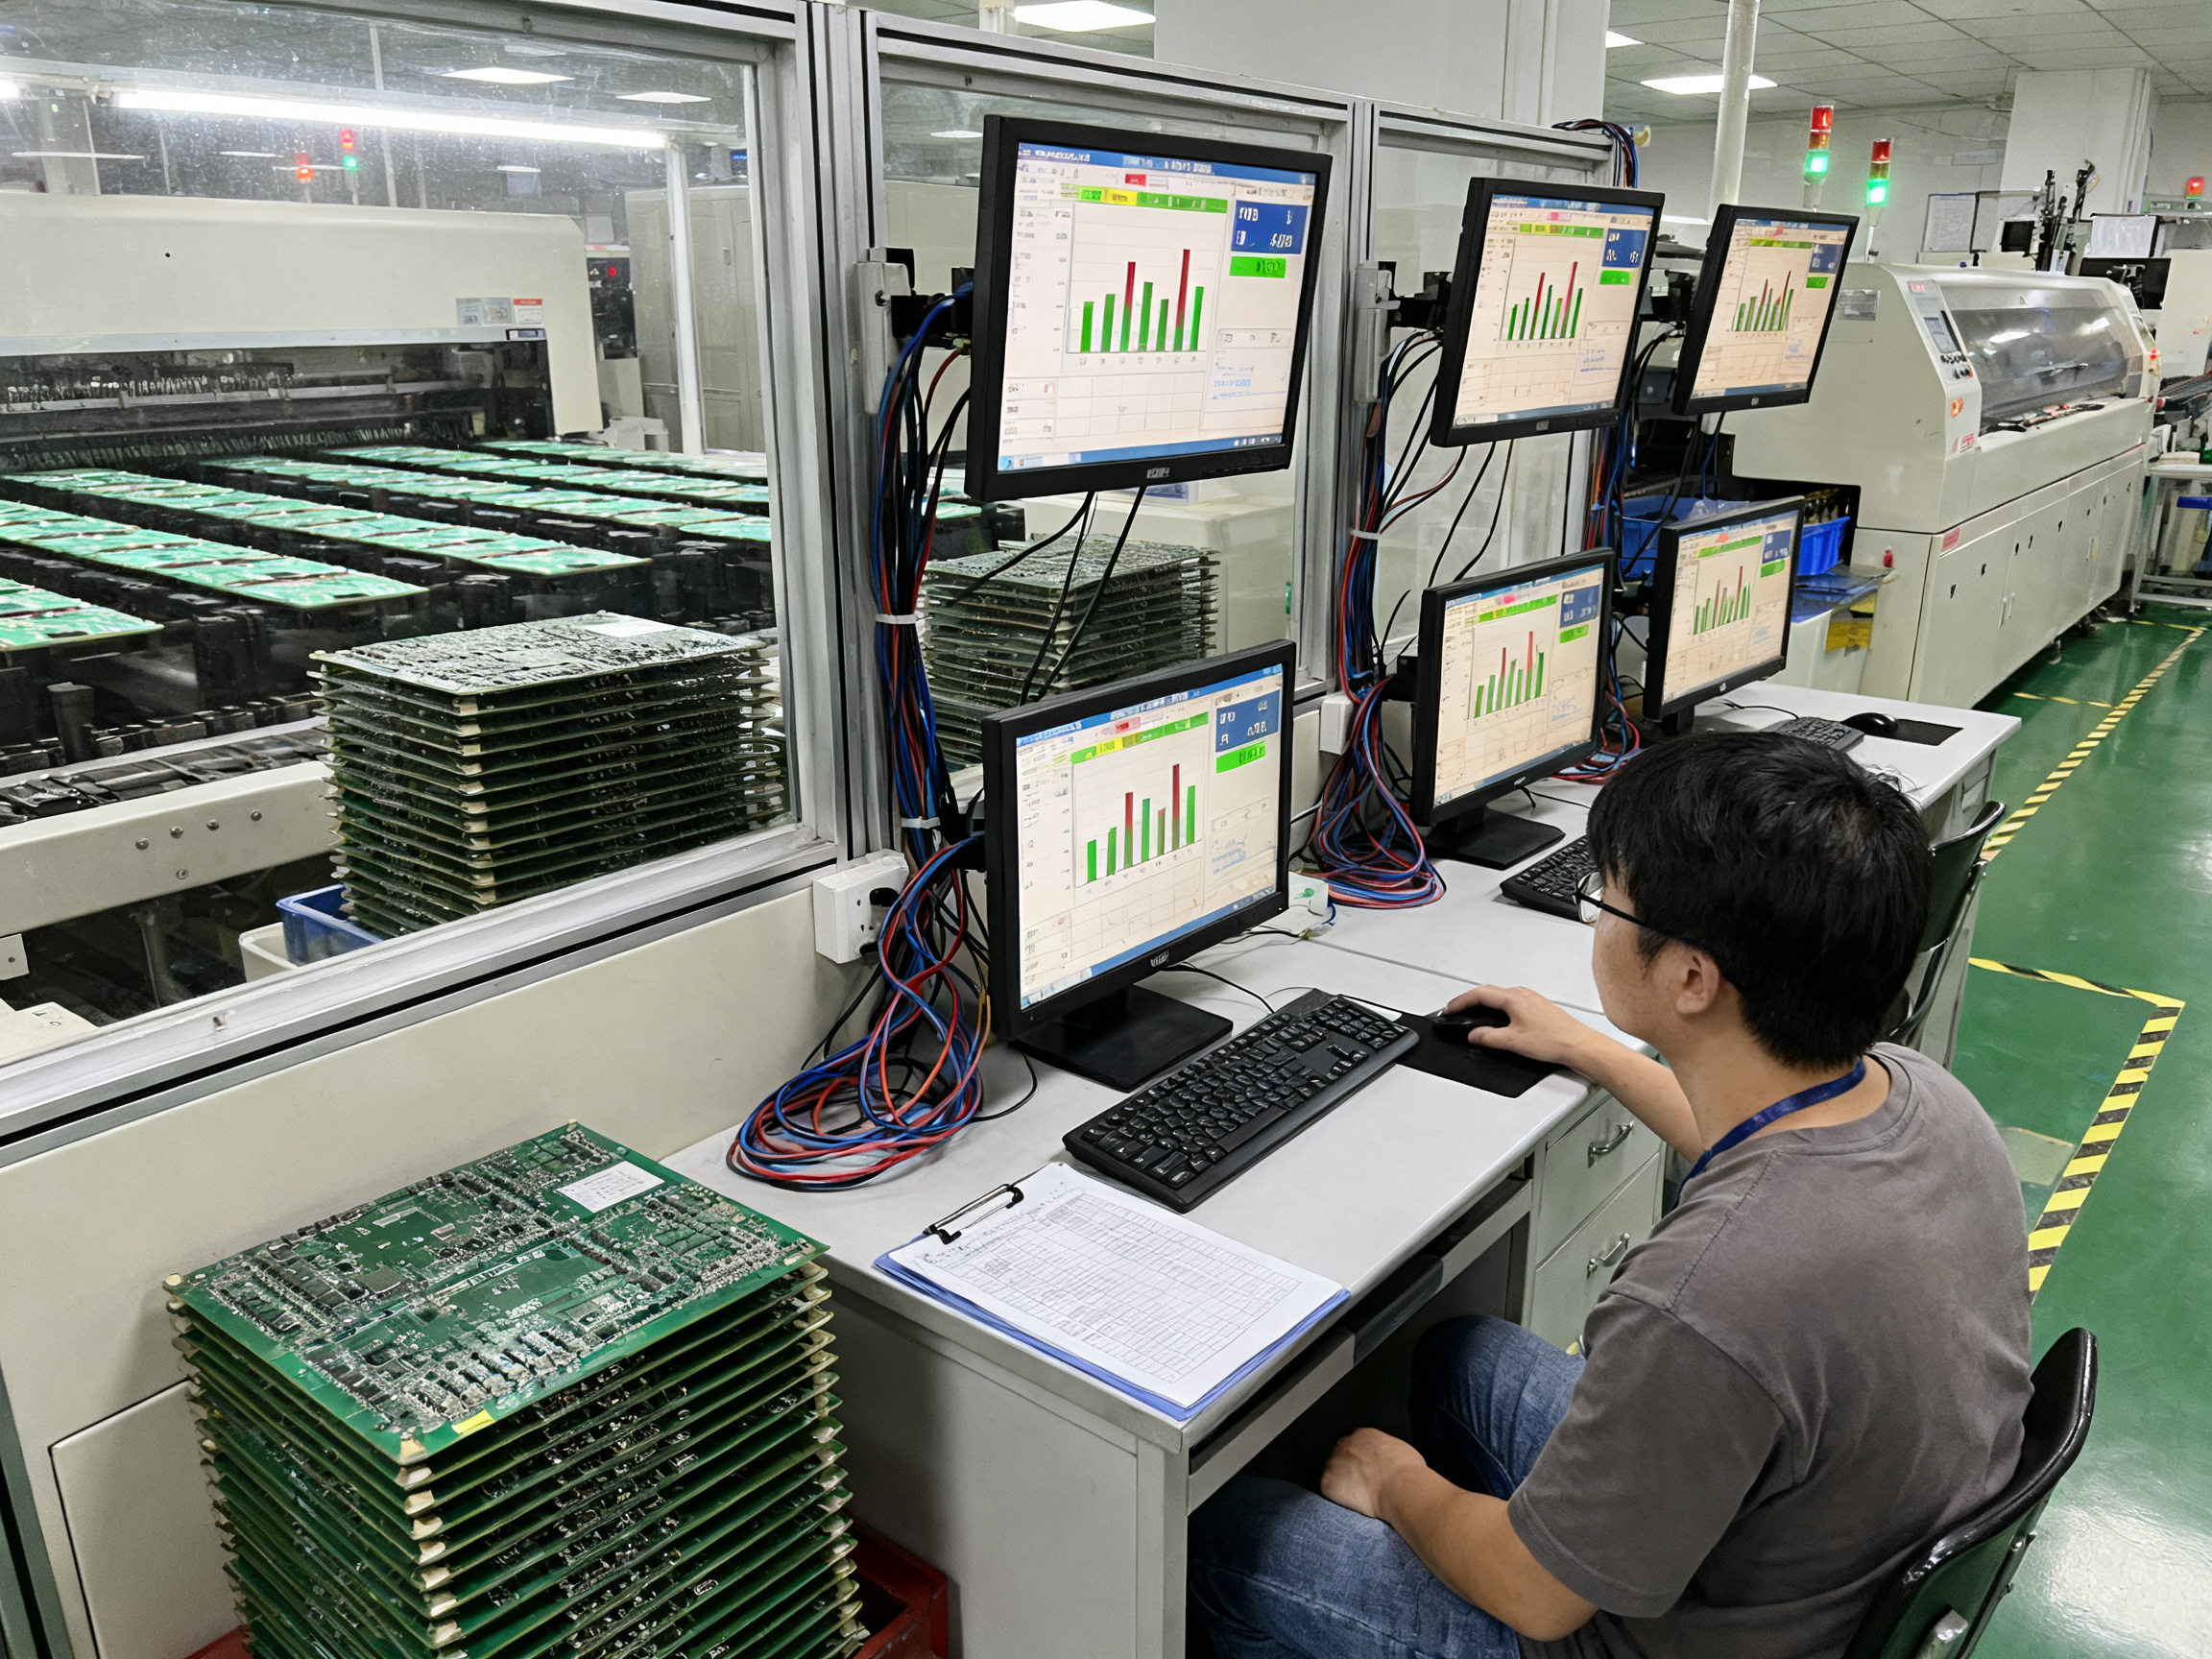
Once you can see where your line is bleeding time, fixing it becomes a whole lot easier.
Advanced Optimization Techniques for Maximum Throughput
So you have your line balanced and running smoothly. That’s great. But there is always another level, right? Let me walk you through some advanced moves that separate the good operations from the great ones.
Parallel Processing and Dual-Lane Configurations
Here is a concept that sounds complicated but is actually pretty straightforward. Instead of running one track through your line, you run two. Parallel processing through dual-lane equipment can effectively double your throughput for compatible product types. One lane handles batch A while the other handles batch B, and both feed into shared inspection and packaging at the end.
The real win here is changeover time. When one lane needs a product swap, the other keeps running. No dead time, no waiting. Your effective operating hours jump significantly because the line never fully stops.
Thing is, dual-lane setups only make sense if your product mix allows it. If you run mostly one board type in huge volumes, a single optimized line might serve you better. But for high-mix operations in 2026, dual-lane is increasingly the standard for serious throughput.
Changeover Optimization
Product changeover optimization reduces downtime between production runs, improving effective operating time. This is where a lot of lines bleed efficiency without realizing it.
Quick changeover comes down to a few things. Standardized feeder positions mean operators know where everything goes without thinking. Pre-staged materials let you swap in under five minutes instead of twenty. And smart recipes stored in your MES let you pull up the exact settings for any product instantly.
We have seen lines that could barely squeeze out 400 boards per shift turn into 600-board operations just by cutting changeover from 45 minutes down to 12. The math is pretty compelling when you run multiple SKUs daily.
Vorausschauende Wartung
Predictive maintenance schedules prevent unplanned downtime that disrupts speed matching and creates temporary bottlenecks. This is probably the most underutilized advanced technique in mid-size shops.
Instead of waiting for a machine to fail or scheduling maintenance on a calendar, predictive approaches use sensor data and historical patterns to tell you exactly when a machine needs attention. Your reflow oven conveyor motor is showing vibration signatures that match its behavior three weeks before the last failure. Fix it now during a lunch break instead of losing a whole shift to emergency repairs.
Modern SMT platforms in 2026 make this easier than ever. Equipment comes with built-in monitoring, and third-party sensors have dropped in cost dramatically.
Aus unserer Erfahrung: We rolled out predictive maintenance monitoring on a customer’s pick-and-place line last quarter. Within six weeks, the system flagged an impending feeder rail failure that we would have completely missed otherwise. We replaced the part during a planned maintenance window. The alternative was three hours of unplanned downtime during peak production. That one catch paid for three months of monitoring costs.
Optimization Techniques at a Glance
| Technique | Complexity | Throughput Impact | Best For |
|———–|———–|——————-|———-|
| Dual-lane parallel processing | High | Up to 2x improvement | High-mix, mid-volume |
| Quick changeover setup | Medium | 20 to 40 percent gains | Multi-SKU production |
| Predictive maintenance | Low to Medium | Eliminates unplanned downtime | All production types |
| AI-assisted line balancing | High | 5 to 10 percent gains | Large-scale operations |
Implementation Roadmap
If you want to push your line further, here is how to phase it in. Start with predictive maintenance if you have not already, because it protects everything else you build. Next, tackle changeover speed to reclaim operating hours. Only move to dual-lane or AI-assisted balancing once those foundations are solid. Trying to run parallel processing on a line with chronic changeover problems just gives you two ways to lose time instead of one.
Small steps first. Build the habits. Then scale up.
Future Trends in SMT Line Speed Optimization
So what does the future hold for SMT line speed matching? If the past few years are any indication, we’re in for some significant changes in how our lines operate.
Here’s what’s coming down the pipe. Industry 4.0 integration keeps pushing forward, and honestly, it’s changing everything about how we approach line synchronization. Instead of tweaking machines one at a time, manufacturers in 2026 are connecting entire lines through smart factory systems. We’re talking about equipment that talks to each other automatically and adjusts on the fly. The days of manually checking each station are fading fast.
Machine learning is probably the biggest shift I’m seeing. AI systems in 2026 can now look at quality data in real time and adjust line speeds before defects even show up. Think about that for a second. Your line senses a problem forming and slows down just enough to prevent it, then speeds back up. That’s not science fiction anymore, that’s what’s starting to roll out across advanced operations. One recent digital twin study showed that manufacturers using these smart systems saw station throughput jumps of over 7 percent with about 6 percent more finished units per hour. Those numbers are hard to ignore.
Sustainability is another pressure that’s reshaping speed optimization. Energy costs keep climbing, and regulations are getting stricter. The good news is that energy efficiency and throughput aren’t always at odds anymore. Research shows that smart buffer placement can cut energy consumption by nearly 2.7 times without hurting your output much. That’s a win for your wallet and for the environment.
Here’s what this means for your team though. The skills needed to run these lines are changing. By 2028, expect strong demand for engineers who understand process analytics, industrial connectivity standards like IPC-CFX and OPC UA, and how to troubleshoot in highly automated environments. The machines get smarter, but we still need people who can set them up right, catch problems early, and keep everything running smoothly.
The bottom line? Speed matching in SMT isn’t going away. It’s just getting smarter. And that means bigger gains for manufacturers willing to adapt.
Conclusion: Your Action Plan for SMT Line Speed Optimization
Alright, let’s bring it all together. Here’s your action plan for SMT line speed optimization.
Step 1: Measure everything first. Before you change a single setting, track actual cycle times across every station. Use real production data, not spec sheets. Figure out where boards are actually piling up versus where you think they should pile up. That gap tells you your true bottleneck.
Step 2: Balance your stations incrementally. Adjust equipment parameters one at a time. Watch your first-pass yield closely. Speed means nothing if you’re making scrap. Match each station to your takt time and let the slowest station set your pace.
Step 3: Put real-time monitoring in place. You cannot manage what you cannot see. Start with one line or even one problem station. Track machine states, downtime reasons, and actual throughput against targets. Build from there.
That’s it. Three steps. Measure, balance, monitor. Then repeat, because your line will change as products evolve and equipment ages.
Aus unserer Erfahrung: The best ROI we have seen comes from manufacturers who start small and stay consistent. One customer tracked their line for four weeks before making any changes. When they finally adjusted their stencil printer speed, they gained 12 percent throughput without touching anything else. Patience plus data beats rushing plus guesswork every time.
The research backs this up. Mature SMT lines targeting 75 to 85 percent overall equipment effectiveness consistently outperform lines running below 60 percent. The difference is not fancy equipment. It is knowing where your line stands and making informed adjustments.
So start today. Measure one station this week. Compare it to your takt time. See what you find.
Quick Action Checklist
- [ ] Track actual cycle times at every station for one full shift
- [ ] Calculate your takt time based on customer demand
- [ ] Identify where WIP builds up between stations
- [ ] Adjust the bottleneck station first
- [ ] Monitor first-pass yield during any speed changes
- [ ] Set up basic real-time monitoring for one line
- [ ] Review throughput data weekly and adjust as needed
Resources for Further Learning
Tools and Software
- ASMPT SMT Analytics for line balance analysis
- Siemens Tecnomatix for line simulation
- Mycronic MYPro Connect for real-time monitoring
Key Formulas to Keep Handy
- Maximum Throughput = 3600 ÷ Bottleneck Cycle Time × Yield Rate
- Takt Time = Available Production Time ÷ Customer Demand
- Realistic Output ≈ Rated CPH × Utilization × First-Pass Yield × Line Balance Factor
Industry Benchmarks (2026)
- World-class single-line efficiency: 75 percent
- High-volume target: 80+ percent
- Top-tier balanced lines: 85+ percent
- Manual handling losses without buffers: 18 to 25 percent
- Manual handling losses with buffers: Under 3 percent
Your next step is simple. Pick one station on your line and time it. Everything else builds from there.