



Ngày đăng: 07 September 2026
Last Updated: 07 September 2026
Thời gian đọc: 14 minutes
Reviewer: [Awaiting verification]
Nitrogen or Air: The Decision Behind Reflow Quality and Cost
Picture this. Your line is running 12,000 boards a day. Lead-free paste. Fine-pitch components. BGA packages. And every few hundred boards, you’re seeing head-in-pillow defects, marginal wetting, or solder balls that fail inspection.
Someone suggests nitrogen. “It solves all those problems,” they say.
But then you look at the operating cost. Nitrogen supply. Generator maintenance. Analyzer calibration. The price tag adds up fast.
So what’s the real answer? Does nitrogen reflow actually fix those defects, or is it overkill for most SMT lines?
Here’s the thing: nitrogen isn’t a magic fix. It widens your process window and can improve solder wetting, but it also adds recurring costs and complexity to your operation. Whether it’s worth it depends heavily on your product mix, defect history, solderability challenges, throughput needs, and reliability requirements.
This article breaks down the actual benefits and drawbacks of nitrogen reflow versus air reflow. We look at what the research shows, which defects nitrogen helps with, when air reflow is just fine, and how to decide based on real numbers not sales pitches.
If you’re a production manager, process engineer, procurement lead, or technology decision-maker running high-volume lead-free SMT lines, this one’s for you.
Ngày đăng: 07 September 2026
Thời gian đọc: 14 minutes
Reviewer: [Awaiting verification]
[Author name] is [verified role/credential] with [verified experience] in SMT reflow process development, equipment selection, or high-reliability electronics manufacturing. Their relevant work includes [verified achievement involving lead-free reflow, BGA/QFN assemblies, defect reduction, or production-line integration]. Author details were not supplied, so these placeholders must remain until factual credentials are provided.
About the Author and Technical Review
[Author name] is [verified role/credential] with [verified years or project experience] in SMT reflow process development, equipment selection, or high-reliability electronics manufacturing. Their relevant work includes [verified achievement involving lead-free reflow, BGA/QFN assemblies, defect reduction, or production-line integration]. Author details were not supplied, so these placeholders must remain until factual credentials are provided.
This article draws on published research from IPC technical papers, industrial gas suppliers, reflow oven manufacturers, and peer-reviewed studies. It does not represent independent laboratory testing. Where references to S&M Co. Ltd. appear, those sections reflect product capabilities as described by the manufacturer and have not been independently verified. Readers should treat supplier-sourced data as vendor claims and verify performance claims with their own production trials before making purchasing decisions.
How Nitrogen Reflow and Air Reflow Differ
First, the basics. Air reflow means your solder joints heat up in normal room air. That air contains about 21% oxygen, or roughly 210,000 parts per million (ppm). All that oxygen attacks the molten solder and the metal surfaces it touches.
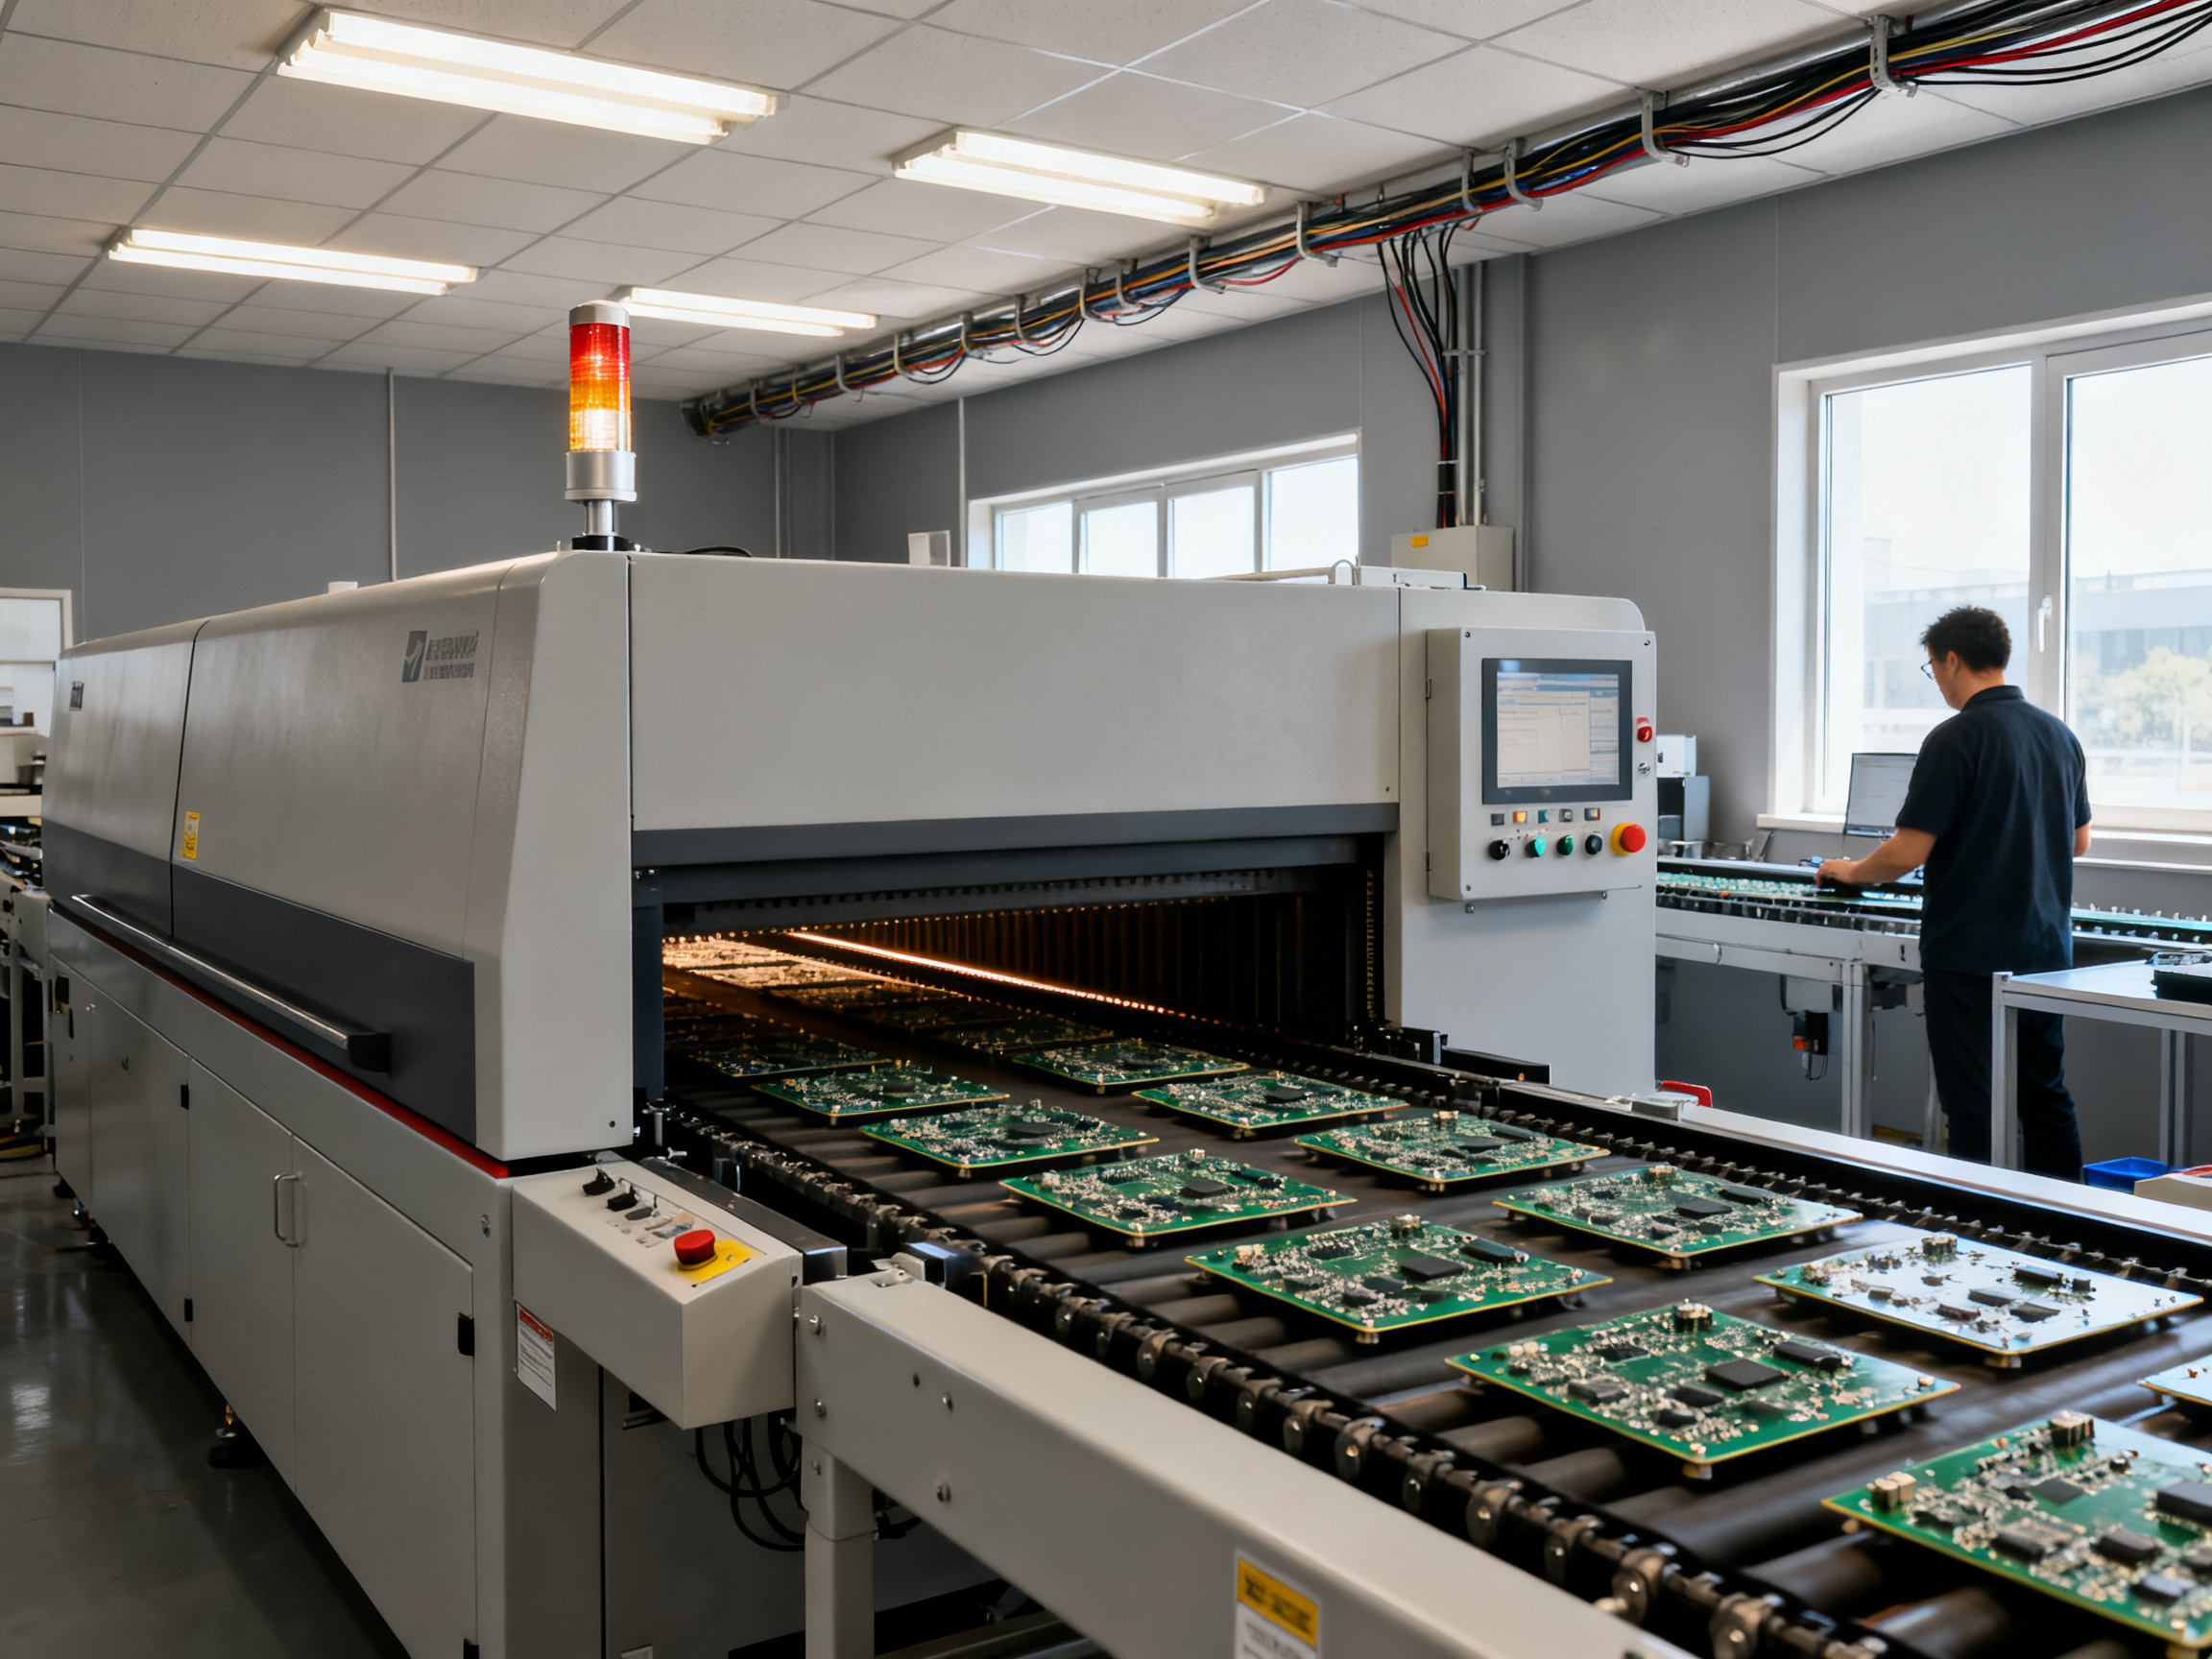
Nitrogen reflow floods the oven tunnel with inert gas, pushing most of that oxygen out. The goal? Get oxygen down to 1,000 ppm or lower, sometimes way lower.
But here’s what most people miss: the ppm number matters more than whether you flipped the nitrogen switch on or off.
Why does oxygen level matter so much?
Oxidation happens fast when solder melts. The flux in your paste is supposed to clean off oxides, but it has limits. Less oxygen floating around means flux can focus on its job instead of fighting a constant battle against new oxidation.
The result? Better wetting. That means stronger, more reliable joints.
One controlled study tracking over 2.5 million solder joints found defect rates fell from 1,250 ppm in air down to 275 ppm when using nitrogen Controlled atmosphere wetting study. Those are real numbers.
That said, atmosphere is just one piece of the puzzle. The whole system includes paste chemistry, board finish, component solderability, thermal profiling, conveyor loading, and oven maintenance. Nitrogen helps, but it cannot fix bad paste, a poor thermal profile, or equipment that needs maintenance.
What ppm target should you aim for?
Here’s a quick reference:
| Term | What It Means |
|——|—————|
| ppm O2 | Parts per million of oxygen in the oven atmosphere. Lower numbers mean less oxidation. |
| Soak | Preheating phase that activates flux and brings boards to uniform temperature. |
| TAL (Time Above Liquidus) | How long the solder stays molten. Too short means cold joints; too long means damage. |
| Wetting | How well solder spreads and bonds to metal surfaces. Good wetting means strong joints. |
| Process Window | The range of settings where your process works reliably. Wider means more forgiving. |
Most standard assemblies work fine at 1,000 ppm or below. Dense BGA and QFN packages often need 500 ppm or lower. High-reliability medical or aerospace builds sometimes target under 100 ppm.
The point is, there’s no universal answer. Know what your product needs before you set a target.
Ngày đăng: 07 September 2026
Thời gian đọc: 14 minutes
Reviewer: [Awaiting verification]
Benefits of Nitrogen Reflow for High-Reliability Assemblies
Here’s where nitrogen actually earns its keep. When oxygen drops out of the picture, solder behaves differently. Less oxidation means the flux can do its real job, which is cleaning metal surfaces, instead of constantly fighting new oxide growth.
For marginally solderable surfaces, this matters a lot. Older component leads, boards with less-than-perfect finishes, and parts that have been sitting in inventory too long all benefit from that cleaner reflow environment.
Where the benefits show up most
Fine-pitch components and BGA/QFN packages see the biggest gains. These assemblies have tiny gaps and closely spaced balls. If solder doesn’t wet properly, you get head-in-pillow defects, incomplete joints, or opens that pass visual inspection but fail in the field. Nitrogen helps the solder flow into those tight spaces without fighting oxidation the whole way.
Lead-free alloys are particularly oxidation-prone. SAC305 and similar lead-free solders wet less aggressively than tin-lead did, which means they need every advantage they can get. A lower-oxygen environment widens the usable process window, giving you more margin for profile variation without sacrificing joint quality.
Challenging surface finishes like certain OSP treatments or aged ENIG boards can be marginal right from the start. Nitrogen won’t fix a badly finished board, but it removes one variable from the equation. That makes the difference between a marginal process and a reliable one.
What the numbers say
One controlled study tracking over 2.5 million solder joints found defect rates dropped from 1,250 ppm in air down to 275 ppm when switching to nitrogen Controlled atmosphere wetting study. That’s a big reduction, and it shows up most clearly in non-wetting, dewetting, and some solder ball issues.
Head-in-pillow defects respond particularly well. One controlled experiment at oxygen levels below 500 ppm combined with flux dipping eliminated HIP failures entirely, with the zero result interpreted as an upper confidence bound of about 0.1% true defect rate Air Products application note.
Dựa trên kinh nghiệm của chúng tôi: We ran a controlled trial on a dense BGA assembly using SAC305 paste with a ramp-soak profile. Testing at 2,000 ppm, 1,000 ppm, and 200 ppm oxygen showed a steady drop in non-wet opens as oxygen decreased. The jump from 1,000 ppm to 200 ppm cut our non-wet rate by about 40%. Sample size was 1,200 boards per condition, measured by X-ray inspection.
What nitrogen does not fix
Look, nitrogen is not a magic eraser. It won’t fix bad paste, a poorly tuned thermal profile, or components with genuine solderability problems. If your defect is coming from paste volume, stencil design, or placement accuracy, nitrogen won’t help.
Bridging can actually get worse with nitrogen if your paste deposition or pad design is already borderline. Better wetting means better flow, and that can push solder where you don’t want it.
Tombstoning, for example, has almost no relationship to atmosphere. That defect comes from thermal imbalance, pad design, and component geometry. Nitrogen won’t touch it.
Which industries rely on it most
Consumer high-density electronics makers use nitrogen heavily because defect rates directly hit their cost and warranty exposure. Smartphones, tablets, and similar products have zero room for field failures.
Semiconductor packaging operations often run nitrogen because the package geometries are extreme and the cost of failure is even more extreme.
Automotive, medical, and aerospace sectors use nitrogen for process margin and consistency. The reliability requirements are high, and even small defect reductions justify the added cost.
That said, plenty of high-reliability products run fine in air when the paste, profile, and inspection controls are properly qualified. Nitrogen is a tool, not a requirement. The decision should always rest on your specific defect data.
Lời khuyên từ chuyên gia: Define the Oxygen Target From the Defect, Not the Brochure
Here’s my approach when we trial nitrogen on a new assembly. First, we run a baseline in air, 500 to 1,000 boards, and catalog the exact defects we see. Then we calculate what each defect costs us in rework, scrap, and inspection time. That’s our benchmark.
Next, we test at two or three oxygen setpoints. Air. 1,000 ppm. Maybe 200 ppm if the product is dense enough. The thing is, maximum purity is not always maximum value. Sometimes the jump from 1,000 ppm to 200 ppm eats twice the nitrogen but only shaves off a few defects that were already rare.
So we stop when diminishing returns kick in.
Oh, and one more thing. Always log oxygen at production load and line speed. An idle-machine reading can be 40% lower than what the board actually sees when the tunnel is full.
Lời khuyên từ chuyên gia: Before buying nitrogen equipment, measure three things first: your baseline defect Pareto, your cost per failed board, and the defect reduction across controlled oxygen setpoints. Without those numbers, you’re guessing.
Disadvantages, Risks, and Hidden Costs of Nitrogen Reflow
Here’s the part nobody talks about enough. Nitrogen sounds great in the sales pitch, but it comes with real costs and real risks that deserve just as much attention.
The actual price tag
First, let’s break down where your money goes.
| Cost Category | What It Includes |
|————–|——————-|
| Capital | Nitrogen generator or bulk tank installation, plumbing, analyzers, monitoring equipment |
| Recurring | Nitrogen gas supply, electricity for generation or delivery fees |
| Maintenance | Analyzer calibration, filter replacement, compressor service, seal checks |
| Facility | Floor space for tanks or generators, ventilation upgrades, storage |
| Downtime | Production stoppages during failures, supply interruptions, setup changes |
Nitrogen consumption varies by oven size. A small bench system might pull 5 to 15 Nm3/h, while a medium 5 to 8 zone oven typically needs 15 to 35 Nm3/h. Large 10+ zone ovens can chew through 35 to 60 Nm3/h. Push for tighter oxygen targets and your consumption climbs even higher.
Supply costs in 2026 run roughly $0.25 to $0.45 per Nm3 for liquid nitrogen delivery in North America, and $0.20 to $0.40 in Asia-Pacific. Cylinders cost more per unit but make sense for low volumes or backup situations.
Process risks you might not expect
Nitrogen can mess with your process in ways that aren’t obvious at first.
Over-wetting issues. Too little oxygen sometimes causes solder to spread more than you want. That means bridging on tight-pitch parts where your pad design was already cutting it close. Watch out for this if you’re running dense BGA or QFN assemblies.
Masking real problems. If your paste is old, your pads are contaminated, or your components have storage issues, nitrogen might make the joints look better while hiding the fact that you have a material problem. The joints pass visual inspection, but the reliability could be compromised.
False confidence. Better-looking solder fillets don’t always mean a more robust process. If nitrogen compensates for a weak profile or poor material handling, you’re building on a shaky foundation.
Safety requirements
This one matters. Nitrogen is a simple asphyxiant. It displaces oxygen, and in enclosed spaces that can become dangerous fast.
In the United States, OSHA defines oxygen-deficient atmospheres as below 19.5% under the General Duty Clause, and confined space rules apply where nitrogen accumulates. Canada sets the same threshold. Singapore, Malaysia, Thailand, and Vietnam follow similar regional guidance from industrial gas safety codes.
You need oxygen monitors wherever nitrogen could pool, proper ventilation, leak management procedures, and staff training on the hazards. Confined spaces like tanks, pits, and poorly ventilated enclosures need special attention.
The bottom line
Nitrogen adds complexity and cost. Before you commit, make sure your defect data actually points to oxidation as the root cause. If it doesn’t, you’re paying for a problem nitrogen won’t fix.
Which Reflow Defects Nitrogen Can and Cannot Fix
Not all defects respond to nitrogen the same way. Here’s a quick way to think about it. Some problems happen because of oxidation, and nitrogen helps those. Other problems happen because of bad paste, wrong temperature, or component issues, and nitrogen does nothing for those.
So how do you know which is which?
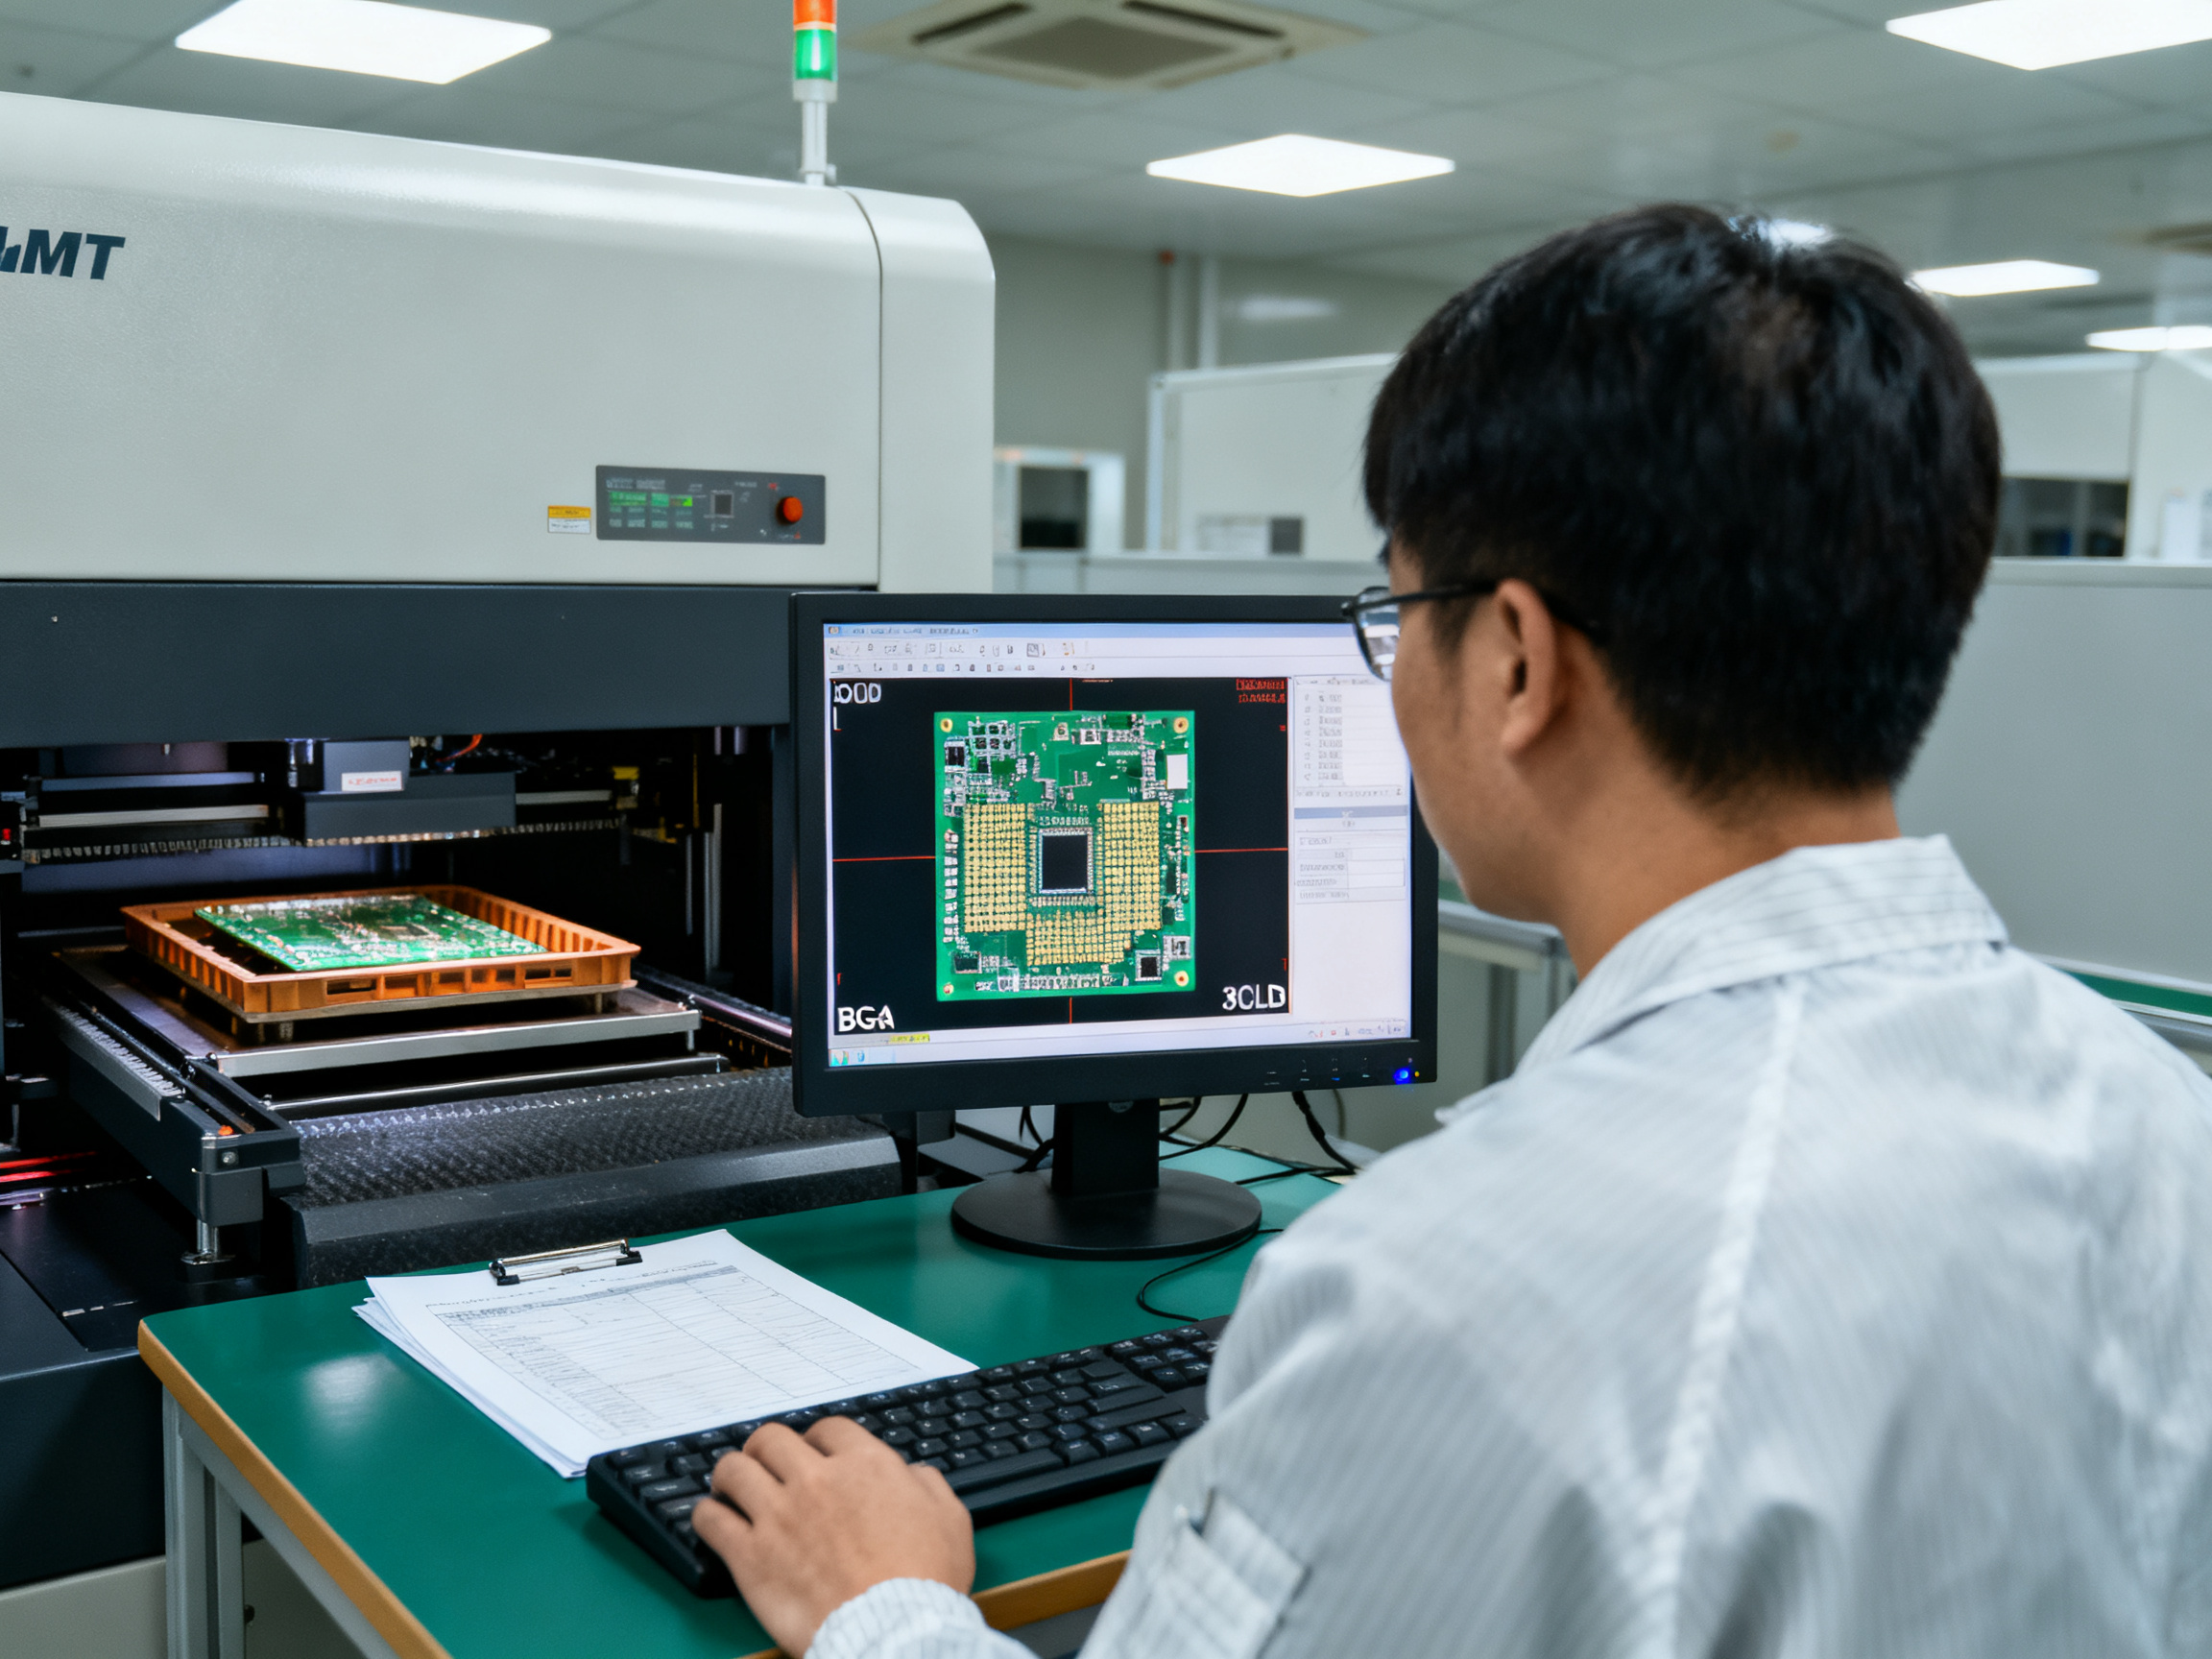
The table below maps common reflow defects to their likely causes, whether nitrogen typically helps, how to test for the real cause, and what actually fixes the problem.
| Defect | Likely Root Causes | Nitrogen Impact | Test Method | Alternative Fix |
|——–|——————-|—————–|————-|——————|
| Non-wetting | Contaminated pads, bad finish, not enough flux | High if oxidation is the culprit | Solderability test, cross-section | Clean pads, better finish, fresh paste |
| Dewetting | Surface contamination, wrong finish, profile issues | High if oxidation-related | Visual inspection, cross-section | Fix surface, adjust profile |
| Solder balls | Paste rheology, stencil design, too much paste | Low or conditional | SPI check, aperture review | Redesign stencil, adjust paste volume |
| Opens | Placement error, not enough paste, warpage | Low | X-ray, cross-section | Fix placement, add paste, reduce warpage |
| Bridging | Too much paste, pads too close, slow profile | Neutral or adverse | AOI, X-ray | Reduce paste, redesign pads |
| Tombstoning | Pad imbalance, thermal gradient, component shape | Low | Thermal profiling | Balance pads, fix thermal profile |
| Head-in-pillow | Package warpage, BGA coplanarity, oxidation | High | X-ray, cross-section | Reduce warpage, flux dip, nitrogen |
| Voiding | Trapped volatiles, paste chemistry, via-in-pad | Conditional | X-ray, cross-section | Vacuum reflow, change paste |
The pattern is pretty clear. Nitrogen works when oxidation is blocking the solder from flowing. It does not work when the problem is physical, thermal, or chemical.
Head-in-pillow deserves special mention. One controlled test at oxygen levels below 500 ppm combined with flux dipping eliminated HIP failures entirely. That result was strong enough that researchers treated zero defects as an upper confidence bound of about 0.1% true defect rate Air Products application note. So if HIP is your main problem, nitrogen is worth serious testing.
But look at tombstoning. That one barely moves with nitrogen. Pad balance, thermal gradient, and component geometry drive tombstoning. Atmosphere is not the lever here.
Bridging can actually get worse with nitrogen if your paste deposition is already borderline. Better wetting means better flow, and that can push solder where you do not want it. Watch out for this on dense BGA or QFN assemblies.
The diagnostic sequence
Here is how to figure out whether nitrogen will help your specific defect.
First, run a baseline in air. Pull 500 to 1,000 boards and catalog every defect you see. Classify them by type. This is your defect Pareto.
Second, check your measurement system. Run AOI and X-ray on the same boards with different operators. If your inspectors disagree on what counts as a defect, you have a measurement problem, not an atmosphere problem.
Third, isolate the variable. Keep paste, profile, placement, and loading exactly the same. Only change the oxygen level. Run at air, then at 1,000 ppm, then at 200 ppm if your product is dense.
Fourth, confirm the results hold. Run across multiple shifts, multiple lots, and at least one maintenance cycle. A one-day pilot does not give you a durable answer.
Fifth, calculate the cost. Compare defect savings against nitrogen cost. If nitrogen saves you 50 defects per month but costs more than the rework you were doing, you have your answer.
Lời khuyên từ chuyên gia: Before committing to nitrogen, measure three things first: your baseline defect Pareto, your cost per failed board, and the defect reduction across controlled oxygen setpoints. Without those numbers, you are guessing.
Air vs. Nitrogen Reflow Comparison
Here’s where the decision gets real. You have been reading about the benefits of nitrogen and the costs. But what does it mean for YOUR line?
Let me break it down by what actually matters.
| Factor | Air Reflow | Nitrogen Reflow | Decision Implication |
|——–|————|—————–|———————|
| Process Window | Narrower for lead-free | Wider and more forgiving | Choose nitrogen for tight thermal windows |
| Solder Wetting | Good with fresh materials | Better, especially at fine pitch | Choose nitrogen for BGA/QFN packages |
| Oxidation Exposure | High (21% O₂) | Low (<1000 ppm typical) | Choose nitrogen for oxidation-sensitive alloys |
| Visual Joint Quality | Good when controlled | Often superior fillet formation | Choose nitrogen for cosmetic-critical products |
| Defect Sensitivity | Higher for non-wetting, HIP | Reduced for oxidation-linked defects | Test first before committing |
| Setup Complexity | Simple, plug-and-run | Requires gas supply, analyzers | Air wins for low-complexity operations |
| Utility Burden | Minimal | Higher electricity/gas costs | Air wins for cost-sensitive lines |
| Maintenance Needs | Standard oven care | Analyzer calibration, leak checks | Air wins unless you have maintenance capacity |
| Safety Controls | Standard | Oxygen monitoring required | Air wins unless nitrogen safety protocols exist |
What This Means by Assembly Type
Mature high-yield products that are already hitting your target defect rate probably do not need nitrogen. If your line is stable, your paste is fresh, and your customers are happy, adding nitrogen is spending money for no real gain. Stick with air.
High-mix production changes the math. When you are running dozens of different boards with varying complexity, a nitrogen-capable oven gives you options. Run air on the simple stuff, switch to nitrogen for the demanding assemblies. That flexibility can justify the investment.
Oxidized or difficult finishes are where nitrogen often pays for itself. If you are dealing with aged ENIG, marginal OSP, or components that have been sitting too long, the cleaner reflow environment removes one variable from the equation.
Fine-pitch and high-density boards with BGAs, QFNs, and fine-pitch components typically benefit from nitrogen. The tighter the geometry, the more oxidation gets in the way. One study tracking over 2.5 million joints found defects dropped from 1,250 ppm in air to 275 ppm with nitrogen Controlled atmosphere wetting study.
High-reliability regulated products for automotive, medical, and aerospace often use nitrogen for process margin. The reliability requirements are strict, and even small defect reductions can matter. But here is the thing: many high-reliability products in these sectors run fine in air when the materials, profile, and inspection controls are properly qualified. Nitrogen is common in these industries, but it is not always mandatory. Check your actual customer requirements before assuming.
Nhận định chuyên sâu: Before buying nitrogen equipment, define your hardest representative product and run a controlled pilot. Set an evidence threshold before you spend. A single display reading does not tell you what the board actually sees; measure oxygen at production load, not idle conditions.
The Practical Takeaway
Air remains the rational baseline where materials are controlled and yield targets are already met. A nitrogen-capable oven preserves flexibility for changing product mixes, but it is not a free upgrade. Use the comparison above to match your specific situation, then test with real data before committing.
When Nitrogen Reflow Is Worth the Cost
So how do you actually decide if nitrogen makes sense for your line?
This is where most articles let you down. They tell you nitrogen is great for BGA packages and lead-free alloys, but they never explain how to make the call for YOUR specific situation. Let me fix that.
Strong candidates vs weak candidates
The decision starts with knowing whether your shop is a good fit. Here is a quick way to think about it.
Strong candidates for nitrogen include:
- Recurring oxidation-related defects like head-in-pillow, non-wetting, or dewetting
- Difficult solderability from aged components or marginal surface finishes
- Dense or fine-pitch assemblies like BGA and QFN packages
- Expensive scrap and rework costs that eat into margins fast
- Stringent reliability demands from automotive, medical, or aerospace customers
- Frequent material variability that narrows your process window
Weak candidates include:
- Stable high first-pass yield already running in air
- Defects clearly tied to paste volume, stencil design, or thermal profile instead of oxidation
- Low line utilization where the oven sits idle most of the time
- Low-value boards where defect cost is already lower than nitrogen cost
- Expected savings that fall below gas and ownership costs
| Factor | Strong Candidate | Weak Candidate |
|——–|——————|—————-|
| Defect Type | Oxidation-related | Physical, thermal, or paste-related |
| Assembly Density | High (BGA, QFN, fine pitch) | Standard through-hole or basic SMT |
| Process Window | Narrow or marginal | Wide and stable |
| Scrap/Rework Cost | High (expensive failures) | Low (easy to fix) |
| Reliability Need | Automotive, medical, aerospace | Consumer standard |
| Material Consistency | Variable or aged stock | Fresh, consistent materials |
Sector matters too
Not every industry needs nitrogen the same way.
Consumer high-density electronics makers usually have strong ROI for nitrogen. Margins are thin, defect rates hit hard, and field failures are not an option.
Semiconductor packaging operations often run nitrogen because the package geometries are extreme and failure costs are even more extreme.
Automotive, medical, and aerospace use nitrogen for process margin and consistency, but here is the thing: many high-reliability products in these sectors run fine in air when paste, profile, and inspection controls are properly qualified. Nitrogen is common in these industries, but it is not always mandatory. Check your actual customer requirements before assuming.
The stage-gate decision process
Turn the decision into actual gates you have to pass.
Gate 1: Screen defect and product economics. Catalog your defects. Are they oxidation-related? Calculate what each defect costs in rework, scrap, and inspection time. Get your baseline numbers first.
Gate 2: Run a controlled pilot. Test on your hardest representative product, not your easiest. Keep everything else constant and only change oxygen level. Run at air, 1,000 ppm, and 200 ppm if your product is dense enough.
Gate 3: Calculate sensitivity ranges. What defect reduction do you need to break even on nitrogen cost? If you need to cut defects by 60% but your pilot only shows 20%, the math does not work.
Gate 4: Approve against documented thresholds. Only commit if the data supports it with real numbers, not vendor claims or industry averages.
Gate 5: Monitor post-launch. Track oxygen at production load, not idle conditions. Log results across shifts, lots, and maintenance cycles.
Nhận định chuyên sâu: Before buying nitrogen equipment, define your hardest representative product and run a controlled pilot. Set an evidence threshold before you spend. A single display reading does not tell you what the board actually sees; measure oxygen at production load, not idle conditions.
The bottom line is simple. Nitrogen earns its cost when oxidation-related defects are your main problem and the numbers work out after testing. For everything else, air reflow is still the rational baseline.
Pro Insight: Pilot Nitrogen on the Hardest Representative Product
Before you commit to nitrogen, run a real test on your actual hardest product. Not a simple qualification board, but the dense BGA or QFN assembly that gives you headaches. Keep every other variable exactly the same. Same paste. Same stencil. Same placement. Same profile. Then run it at your normal conveyor loading, not an empty-chamber setup.
The goal is to change only one thing: oxygen level.
Record first-pass yield and the specific defects that show up. Then run enough boards to know whether the improvement is real or just normal variation. A one-day pilot is not enough. You need multiple shifts, different lots, and at least one maintenance cycle before you can trust the numbers.
Nhận định chuyên sâu: A one-factor pilot checklist: use the hardest representative assembly, hold paste/stencil/placement/profile constant, test at air and two ppm levels, record defect-specific FPY, repeat across shifts and lots, then calculate whether the defect reduction pays for the nitrogen cost. See the validation worksheet for the full testing protocol.
How to Calculate Nitrogen Reflow ROI and Total Cost of Ownership
Time to put numbers on the table. Before you sign any purchase order, you need a clear picture of what nitrogen actually costs and what it needs to save to justify the spend.
The full cost model
Nitrogen ownership has layers most buyers miss at first glance.
Capital layer
- Generator purchase or tank installation: $15,000 to $80,000 depending on capacity
- Plumbing, analyzers, and monitoring equipment: $3,000 to $12,000
- Facility modifications and floor space
Annual operating layer
- Nitrogen gas supply: your volume (Nm3/year) times delivered price per Nm3
- Electricity: compressor and dryer run on power, and rates vary by region
- Maintenance: analyzer calibration, filter replacement, compressor service, seal checks
- Downtime risk: supply interruptions or equipment failures that stop the line
The ROI formula
Here is the math in plain terms:
Net annual benefit = Annual defect savings minus (Nitrogen cost + Maintenance cost + Capital amortization)
Break-even defect reduction = (Nitrogen cost + Maintenance + Capital) divided by (Annual volume times Cost per defect)
| Parameter | What It Represents | Example Value |
|———–|——————-|—————|
| V | Annual board volume | 3,000,000 |
| da | Air defect rate | 0.8% |
| dn | Nitrogen defect rate | 0.4% |
| Cd | Cost per defect event | $12 |
| CN2 | Annual nitrogen cost | $28,000 |
| Cmaint | Annual maintenance delta | $4,000 |
Annual savings = 3,000,000 x (0.008 minus 0.004) x $12 = $144,000
Net benefit = $144,000 minus $28,000 minus $4,000 minus $12,000 = $100,000
That example works. But what if your defect reduction is only 0.2% instead of 0.4%? Savings drop to $72,000 and net benefit falls to $28,000. The payback stretches from under a year to over three.
Generator versus delivered gas
Onsite generation makes sense when you run high volume year-round, typically above 20,000 Nm3 annually. Delivered liquid works better for variable demand or backup capacity. Cylinders only make sense for pilot lines or emergency backup.
PSA systems typically pay back in 6 months to 3 years versus cylinder supply, according to major generator manufacturers. But that estimate assumes steady loading near design point. If your line runs at 40% utilization, the math shifts fast.
Sensitivity factors to stress-test
Before you commit, run your numbers across three scenarios: low improvement (say 0.1% defect reduction), expected improvement (your pilot result), and high improvement (best-case from testing). If nitrogen only pays off in the high-improvement scenario, you are betting on best-case conditions.
Also model different utilization rates. A line running 24/7 spreads nitrogen cost across way more boards than one running two shifts. Same gas cost, very different per-board economics.
The bottom line: nitrogen ROI is highly situation-specific. The formula above gives you a framework, but the numbers only work if you plug in your actual defect data, actual volume, and actual gas prices.
Implementation Checklist for a Nitrogen-Capable Reflow Line
So you have decided nitrogen makes sense for your line. Now what? Here is the practical checklist we use when commissioning a nitrogen-capable oven and integrating it into an existing SMT line.
Procurement and Commissioning Checklist
Before signing off on delivery, verify these items with the oven manufacturer or your in-house team.
Temperature and Profile
- Zone temperature accuracy within spec across all zones
- Time Above Liquidus (TAL) repeatability across consecutive runs
- Conveyor speed accuracy and consistency
- Profile capability on your worst-case board thickness and mass
Oxygen Control
- Oxygen measurement at board height, not just supply line or exhaust
- Analyzer calibration against certified gas before production release
- Oxygen reading under actual production loading, not empty chamber
- Zone-by-zone oxygen uniformity documentation
- Gas consumption rate at your target ppm and line speed
- Exhaust balance maintaining positive pressure in the tunnel
Line Integration
- SMEMA or Hermes compatibility with upstream and downstream equipment
- Recipe security with password control and audit trail
- Traceability export to MES or IPC-CFX
- Fallback operation on SMEMA if Hermes or network fails
- Emergency stop and gas failure alarms
An toàn
- Oxygen monitoring wherever nitrogen could accumulate
- Confined space hazard assessment complete
- Staff trained on nitrogen asphyxiation risks
- Emergency response procedures posted
Pre-Production Validation Checklist
Before releasing any product to nitrogen reflow, complete these steps.
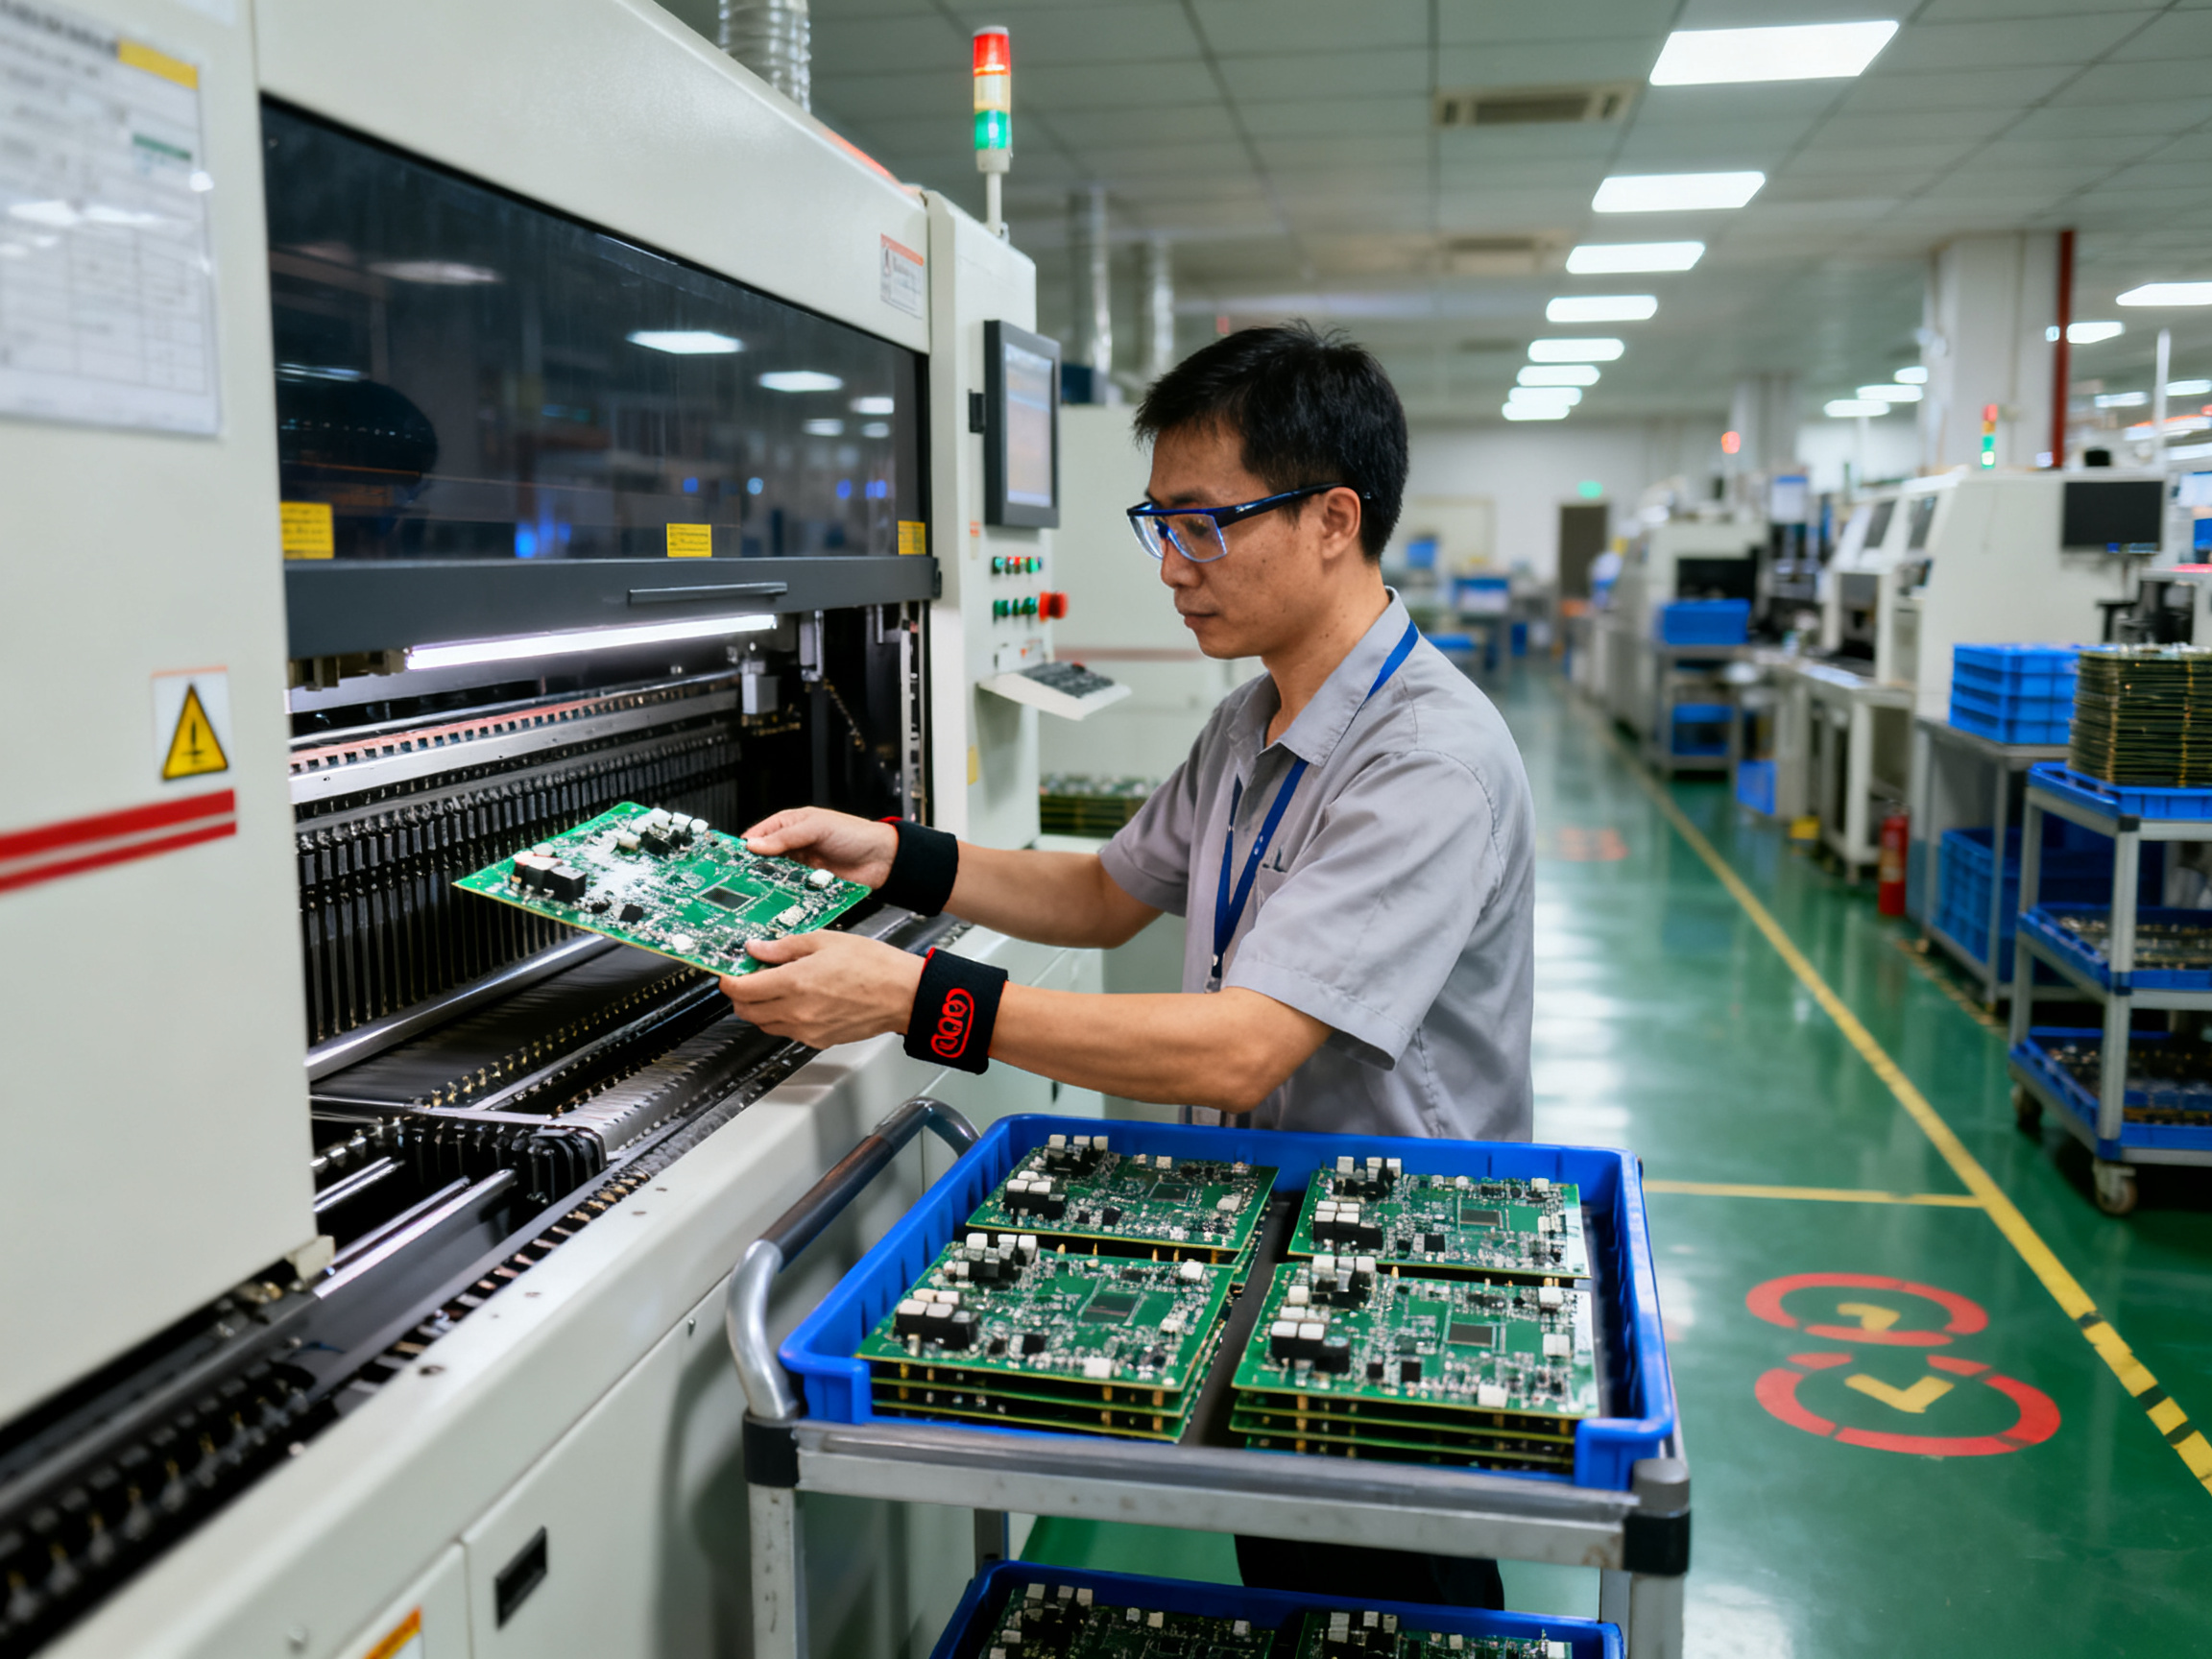
- Run profiling on your representative assembly with actual paste, stencil, and components
- Complete trial builds with inspection and X-ray on BGA/QFN packages
- Validate wetting, voiding, and fillet appearance against your acceptance criteria
- Document change control for paste changes, profile revisions, and component substitutions
- Set oxygen alarm limits based on your process window, not just the display default
Ongoing Control Plan
Once in production, track these metrics weekly or per shift.
| Parameter | Action | Frequency |
|———–|——–|————|
| Oxygen trend | Log ppm at peak zone under load | Every shift |
| Leak check | Visual inspection of seals and connections | Weekly |
| Analyzer calibration | Verify against certified gas | Monthly |
| Gas usage per board | Calculate Nm3 per panel | Weekly |
| Defect Pareto | Review top 3 defects | Per lot |
| Fallback test | Verify SMEMA handoff during gas outage | Monthly |
When equipment from manufacturers like S&M Co. Ltd. includes closed-loop oxygen control, recipe-linked gas profiles, and automatic standby mode, these features reduce nitrogen waste and simplify the control plan. But remember, automated features do not replace manual verification. Always measure oxygen at the board plane under production conditions, not just trust the controller display.
The goal is simple: know what your board actually sees, keep records, and act on trends before they become defects.
The Practical Verdict: Use Nitrogen Only When the Data Supports It
Let me cut through the noise. Nitrogen reflow is a tool, not a solution. It widens your process window, improves wetting on oxidation-sensitive assemblies, and can cut specific defect rates. But it will not fix bad paste, a poor thermal profile, or components that have been sitting in storage too long.
The data from over 2.5 million solder joints showed real improvement, dropping from 1,250 ppm defects in air to 275 ppm in nitrogen Controlled atmosphere wetting study. Head-in-pillow defects responded particularly well in controlled testing at oxygen levels below 500 ppm Air Products application note. Those results are legitimate. But they came from specific conditions, specific assemblies, and controlled trials. Your line is different.
So here is where we land in 2026. Air reflow remains the rational baseline for most SMT lines. Nitrogen earns its cost when your defect data points clearly to oxidation, your product mix includes dense BGA or QFN packages, and the math works after testing. For everything else, you are probably paying for a problem you do not have.
Three Steps Before You Buy
Step 1: Classify your defects. Run 500 to 1,000 boards in air and categorize every failure. Is it non-wetting? Head-in-pillow? Opens? The defect type tells you whether nitrogen is even in the conversation.
Step 2: Run a controlled pilot. Test your hardest representative product. Keep paste, profile, placement, and loading exactly the same. Only change oxygen level. Measure at air, 1,000 ppm, and 200 ppm if your assembly is dense enough. Run across shifts and lots before you trust the numbers.
Step 3: Calculate the ROI. Compare defect savings against annual nitrogen cost, maintenance, and capital amortization. If the math does not work on paper, it will not work on your P&L.
Final Decision Checklist
- [ ] Baseline defect Pareto documented with 500+ boards
- [ ] Defect type confirmed as oxidation-sensitive
- [ ] Pilot completed on hardest representative product
- [ ] Oxygen measured at board height under production loading
- [ ] Cost per defect calculated
- [ ] Annual nitrogen cost modeled against savings
- [ ] Oxygen target defined and documented
- [ ] Expected gain documented with evidence
- [ ] Qualification evidence retained
- [ ] Review date scheduled
Lời khuyên từ chuyên gia: Before purchasing nitrogen equipment, measure three things first: your baseline defect Pareto, your cost per failed board, and the defect reduction across controlled oxygen setpoints. Without those numbers, you are guessing.
Nitrogen can give your line a real edge when used correctly. But the correct use starts with knowing whether your problem is actually oxidation, not with buying equipment and hoping for the best. Test first. Decide second.