



Published: 28 August 2026
Last Updated: 28 August 2026
Reading Time: 12 minutes> Published: 28 August 2026
Last Updated: 28 August 2026
Reading Time: 12 minutes
You know that feeling when your SMT line should be cranking out boards, but the output numbers just don’t add up? You’re not alone. In 2026, most high-mix SMT lines are running at a fraction of what they should be capable of, and the culprit is usually something that looks deceptively simple: line-speed mismatch.
Here’s what that actually means in practice. Your solder paste printer might be zipping along at full speed while your pick-and-place machine is still trying to keep up. Meanwhile, your reflow oven is either baking boards too fast or sitting idle, waiting for the next one. The inspection station downstream is either flooded or starving. Each piece of equipment is doing its job fine, but together they’re tripping over each other like dancers who haven’t learned the same steps.
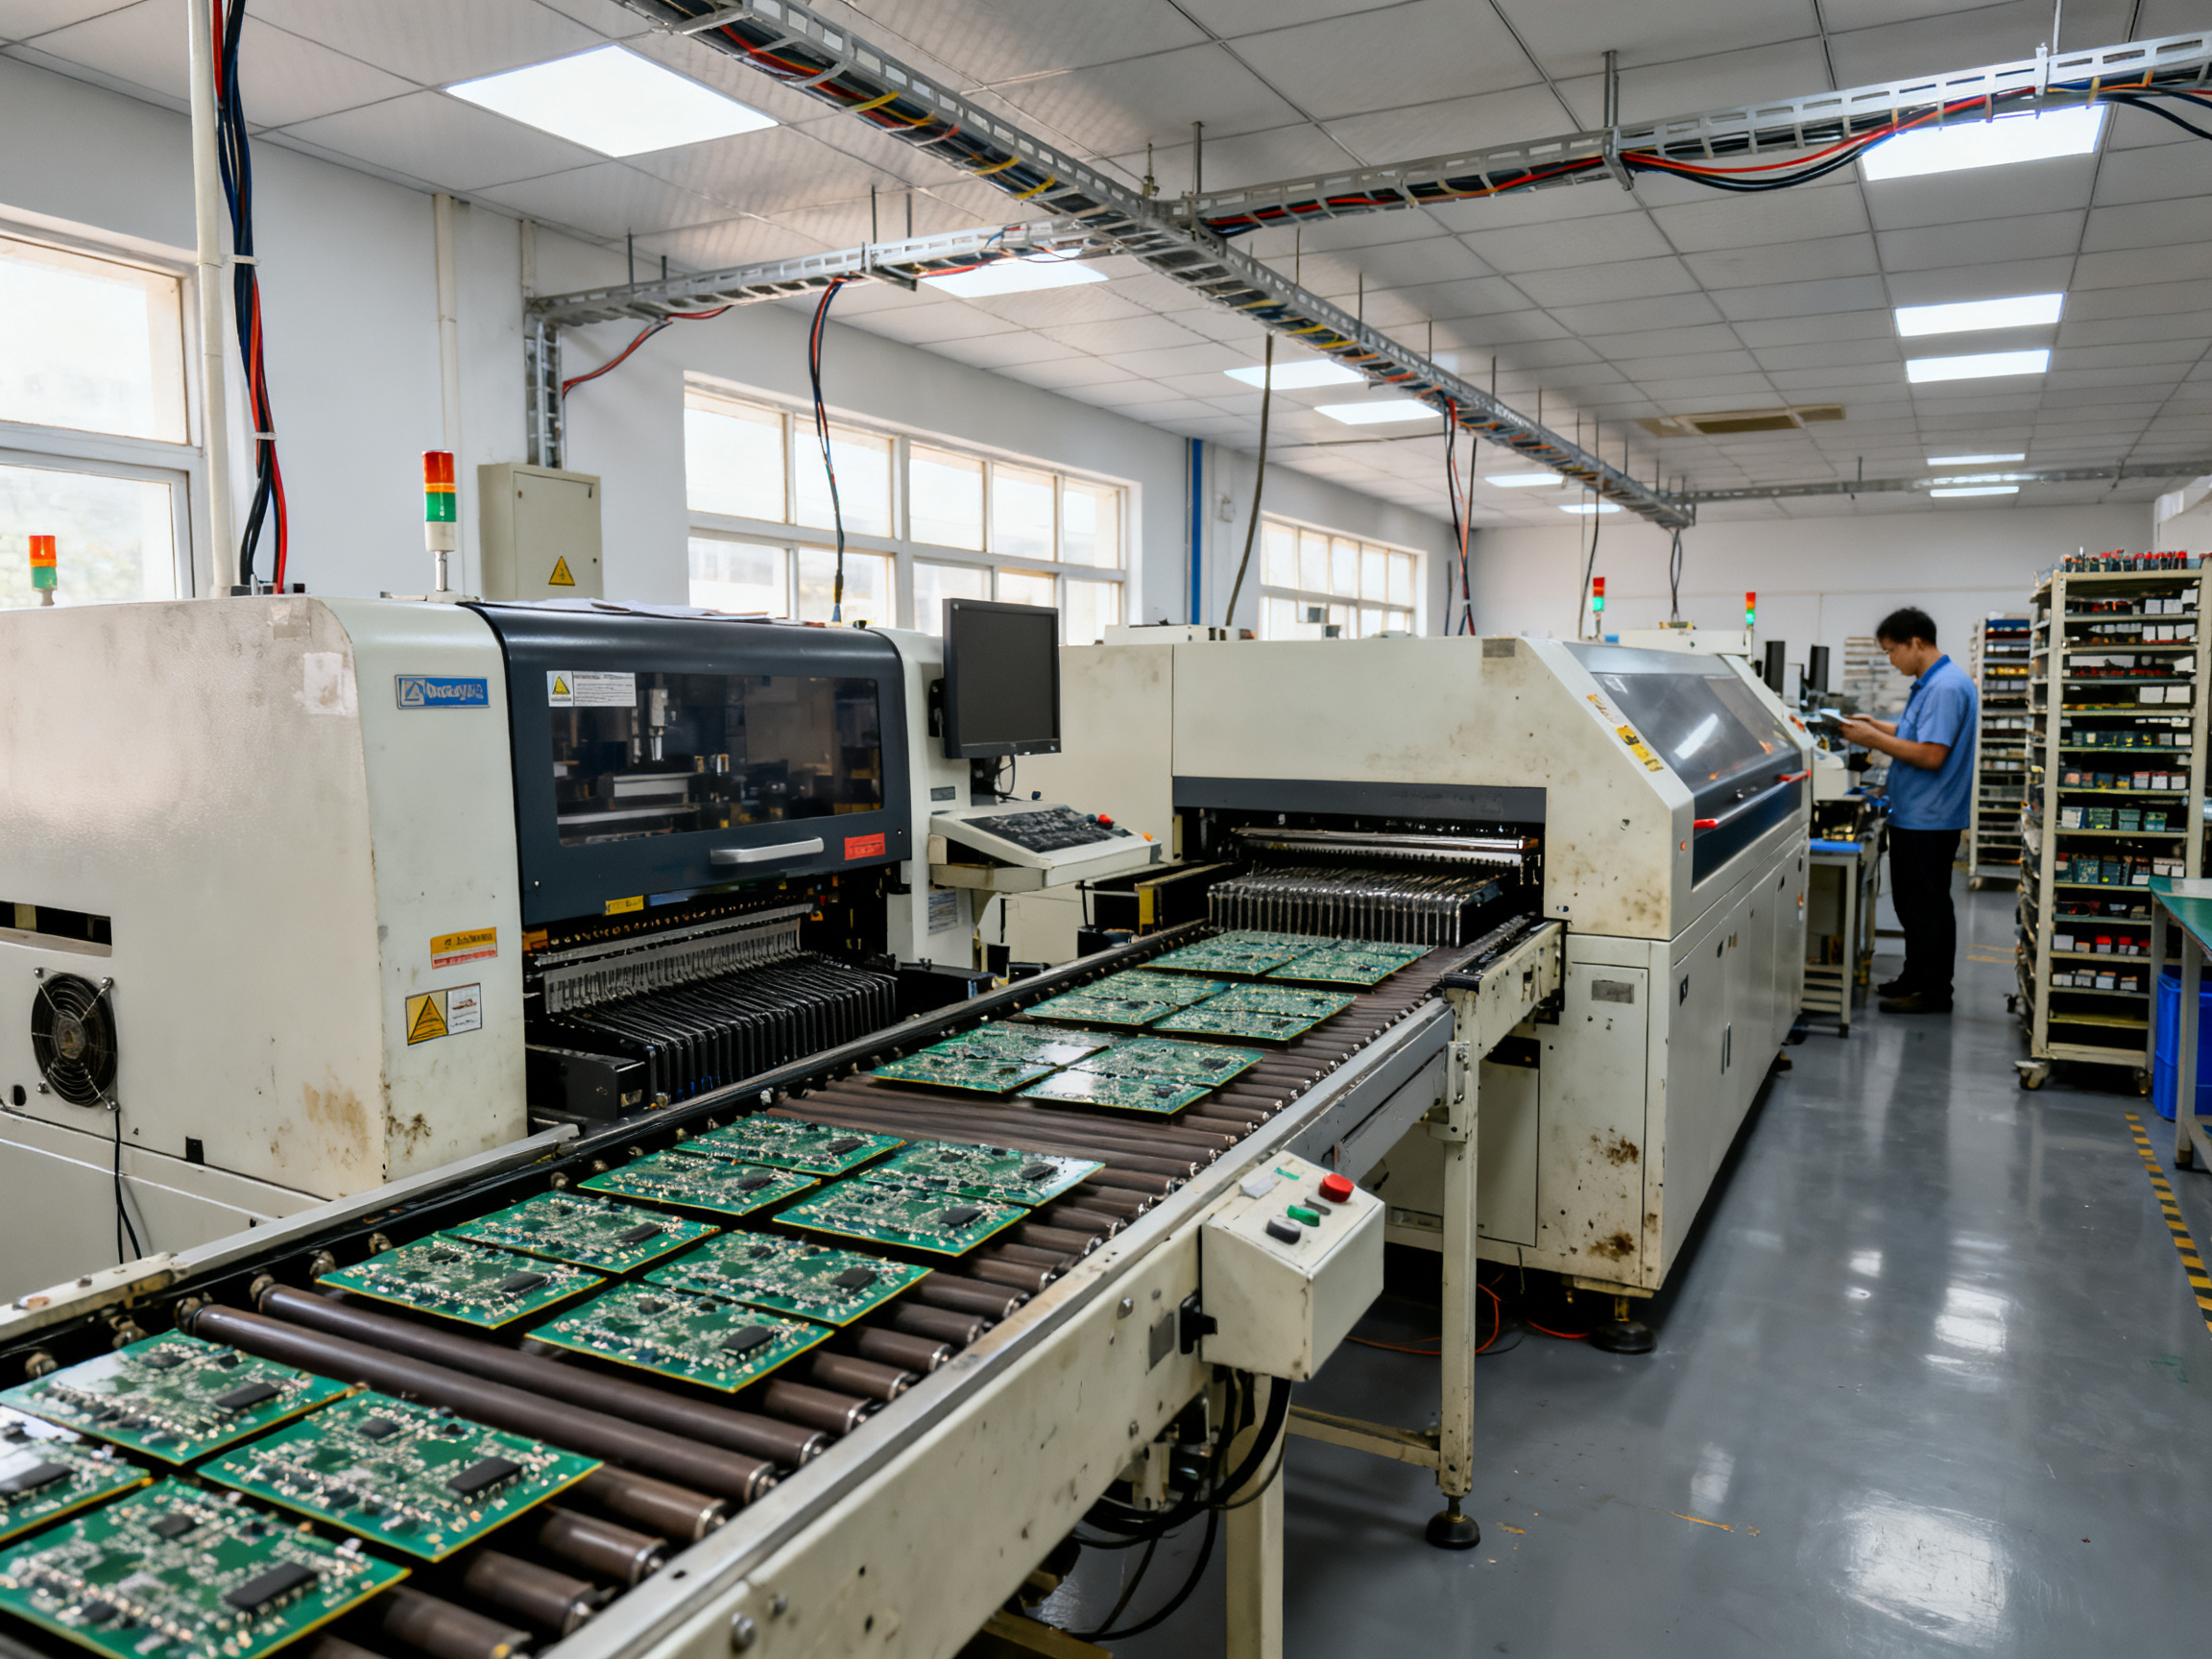
The numbers are pretty eye-opening. Studies show that many SMT lines deliver only 30 to 60 percent of their nameplate throughput once you factor in real product mix, feeder swaps, and rework loops. Changeovers alone can eat up 10 to 25 percent of your available production time if your line isn’t balanced to handle them. And here’s a kicker: the bottleneck station isn’t always where you’d expect. Most people assume it’s the placement machine, but manual board handling, printer setup, and even inspection bottlenecks can steal more time than the flashy pick-and-place head.
So what’s a production leader to do? This guide walks through the best SMT line speed matching tools and throughput optimization software available in 2026. Whether you’re a process engineer trying to squeeze more output from an existing line or a production manager evaluating new software investments, we’ll break down what actually works, what to watch out for, and how to measure whether it’s worth it.
Let’s get into it.
Jace Liu is a process optimization specialist with over 12 years of hands-on experience in SMT manufacturing, spanning pilot production through high-volume EMS operations. He has led line-balancing projects across multiple OEM facilities and regularly contributes to industry working groups on throughput modeling and changeover reduction.## Author Bio
Jace Liu is a process optimization specialist with over 12 years of hands-on experience in SMT manufacturing, spanning pilot production through high-volume EMS operations. He has led line-balancing projects across multiple OEM facilities and regularly contributes to industry working groups on throughput modeling and changeover reduction.
What SMT Line Speed Matching Software Actually Does
At its core, SMT line speed matching software treats your entire production line as one interconnected system. Instead of just looking at individual machine specs, it models how each station (printer, placement, reflow, inspection) affects the others in real time.
Here’s what that looks like in practice. The software pulls in cycle times from your printer, pick-and-place heads, and reflow oven. It accounts for buffer capacity between stations. It factors in changeover times, feeder swap requirements, and even reflow profile constraints that might slow things down. The goal is to find where your line is actually losing time, which is rarely where the nameplate specs say it should be.
Now, let’s clear up some confusion. Line speed matching is not the same as generic scheduling software. Scheduling tools tell you what to run when. Speed matching software tells you how fast your line can actually run given your current product mix, equipment constraints, and changeover patterns. And throughput optimization? That’s the bigger picture goal that both feed into, but it’s not a specific function.
The gap between these categories matters. A basic scheduler might schedule 500 boards per hour. Your speed matching software will tell you why you’re probably getting 320, and which specific station is to blame.
Why high-mix lines need this most: Changeovers are where most lines bleed time. When you’re switching products multiple times per shift, the software models how to sequence those changeovers to minimize dead time. It identifies carryover feeders you can keep in place, hot-swap opportunities, and reflow profile overlaps between products. This is exactly where we see the biggest gains in high-mix environments, and it’s why generic scheduling falls short.
| Line Stage | Typical Speed Constraint | Key Data Inputs |
|————|————————-|——————|
| Solder Paste Printer | Snap-off and print speed | Board dimensions, paste type, stencil config |
| Pick-and-Place | Component access time | Component mix, feeder count, nozzle changes |
| Reflow Oven | Zone balance and profile | Product thermal mass, profile length, belt width |
| AOI/Inspection | Inspection complexity | Board density, defect history, algorithm settings |
The table above shows you the typical friction points. Your speed matching software takes all of these inputs and calculates the actual bottleneck, which often surprises people. It’s rarely the placement machine everyone worries about.## What to Evaluate Before You Buy
Before you start demoing software or talking to vendors, get clear on what actually matters for your line. Not every tool on the market is built for high-mix environments, and the difference can cost you both money and time.
First, check whether the tool handles mixed product demand, not just steady-state volume runs. Most legacy systems assume you’re running the same board all day. In 2026, that’s not realistic for most shops. You need optimization logic that models changeovers, feeder swaps, and reflow profile transitions as part of normal operation. If the software treats changeover time as a special case or exception, it’s probably not built for your reality.
Next, dig into component and process compatibility. Can it model BGA and QFN packages with their thermal and placement constraints? Does it handle lead-free reflow profiles with their tighter process windows? These aren’t edge cases anymore. Ask the vendor specifically about defect-risk tradeoffs: what happens to first-pass yield when you push belt speed? How does the model account for solder paste aging or stencil wear? A tool that glosses over these details will give you numbers that look good on paper but fall apart on the floor.
Third, look at the reporting and explanation layer. The software might identify a bottleneck correctly, but if it can’t tell you why, your team can’t act on it. You want a system that shows which station is limiting output, what the constraint is (feeder access, thermal mass, cycle time), and what change would move the needle most. If the output is just a dashboard with green lights and red lights, you’re still doing the analysis yourself.
Finally, evaluate ease of use honestly. How long does it take to get from raw data to actionable recommendation? Is the interface built for engineers or executives? Can operators actually use it without constant IT support?
| Evaluation Dimension | What to Look For |
|———————|——————|
| Optimization Quality | Mixed-product logic, changeover modeling, real constraint identification |
| Integration Depth | Printer, placement, reflow, AOI data feeds; MES/ERP connectivity |
| Explanation Quality | Bottleneck rationale, recommendation confidence, actionable output |
| Ease of Use | Time to insight, operator interface, IT dependency |
The vendors worth your time will have answers ready for all four. The ones who deflect or promise to add it later are telling you something important about their roadmap and commitment to high-mix environments.
Optimization Methods That Matter in High-Mix Lines
Here’s where things get practical. Line balancing, bottleneck shifting, and changeover-aware sequencing sound like separate problems, and they are, but your software needs to handle all three at once if you want real gains.
Line balancing means making sure no single station is starving the line or getting overwhelmed. Your solder paste printer, pick-and-place heads, reflow oven, and inspection station all have to work together. The trick is that the bottleneck moves. One product might be limited by placement time. Switch to a thermally heavy board and suddenly your reflow oven is the chokepoint. Good optimization software tracks these shifts dynamically instead of assuming one station is always your constraint.
Bottleneck shifting is actually your friend in a high-mix environment. When we model lines for clients, we often find that accepting a known bottleneck and optimizing around it delivers better results than trying to eliminate it entirely. The goal is predictable throughput, not theoretical maximum output from every station.
Changeover-aware sequencing is where most lines bleed time. The software should identify carryover feeders you can keep in place between products, hot-swap opportunities, and reflow profile overlaps. We typically see the biggest gains come from smart sequencing rather than faster individual stations.
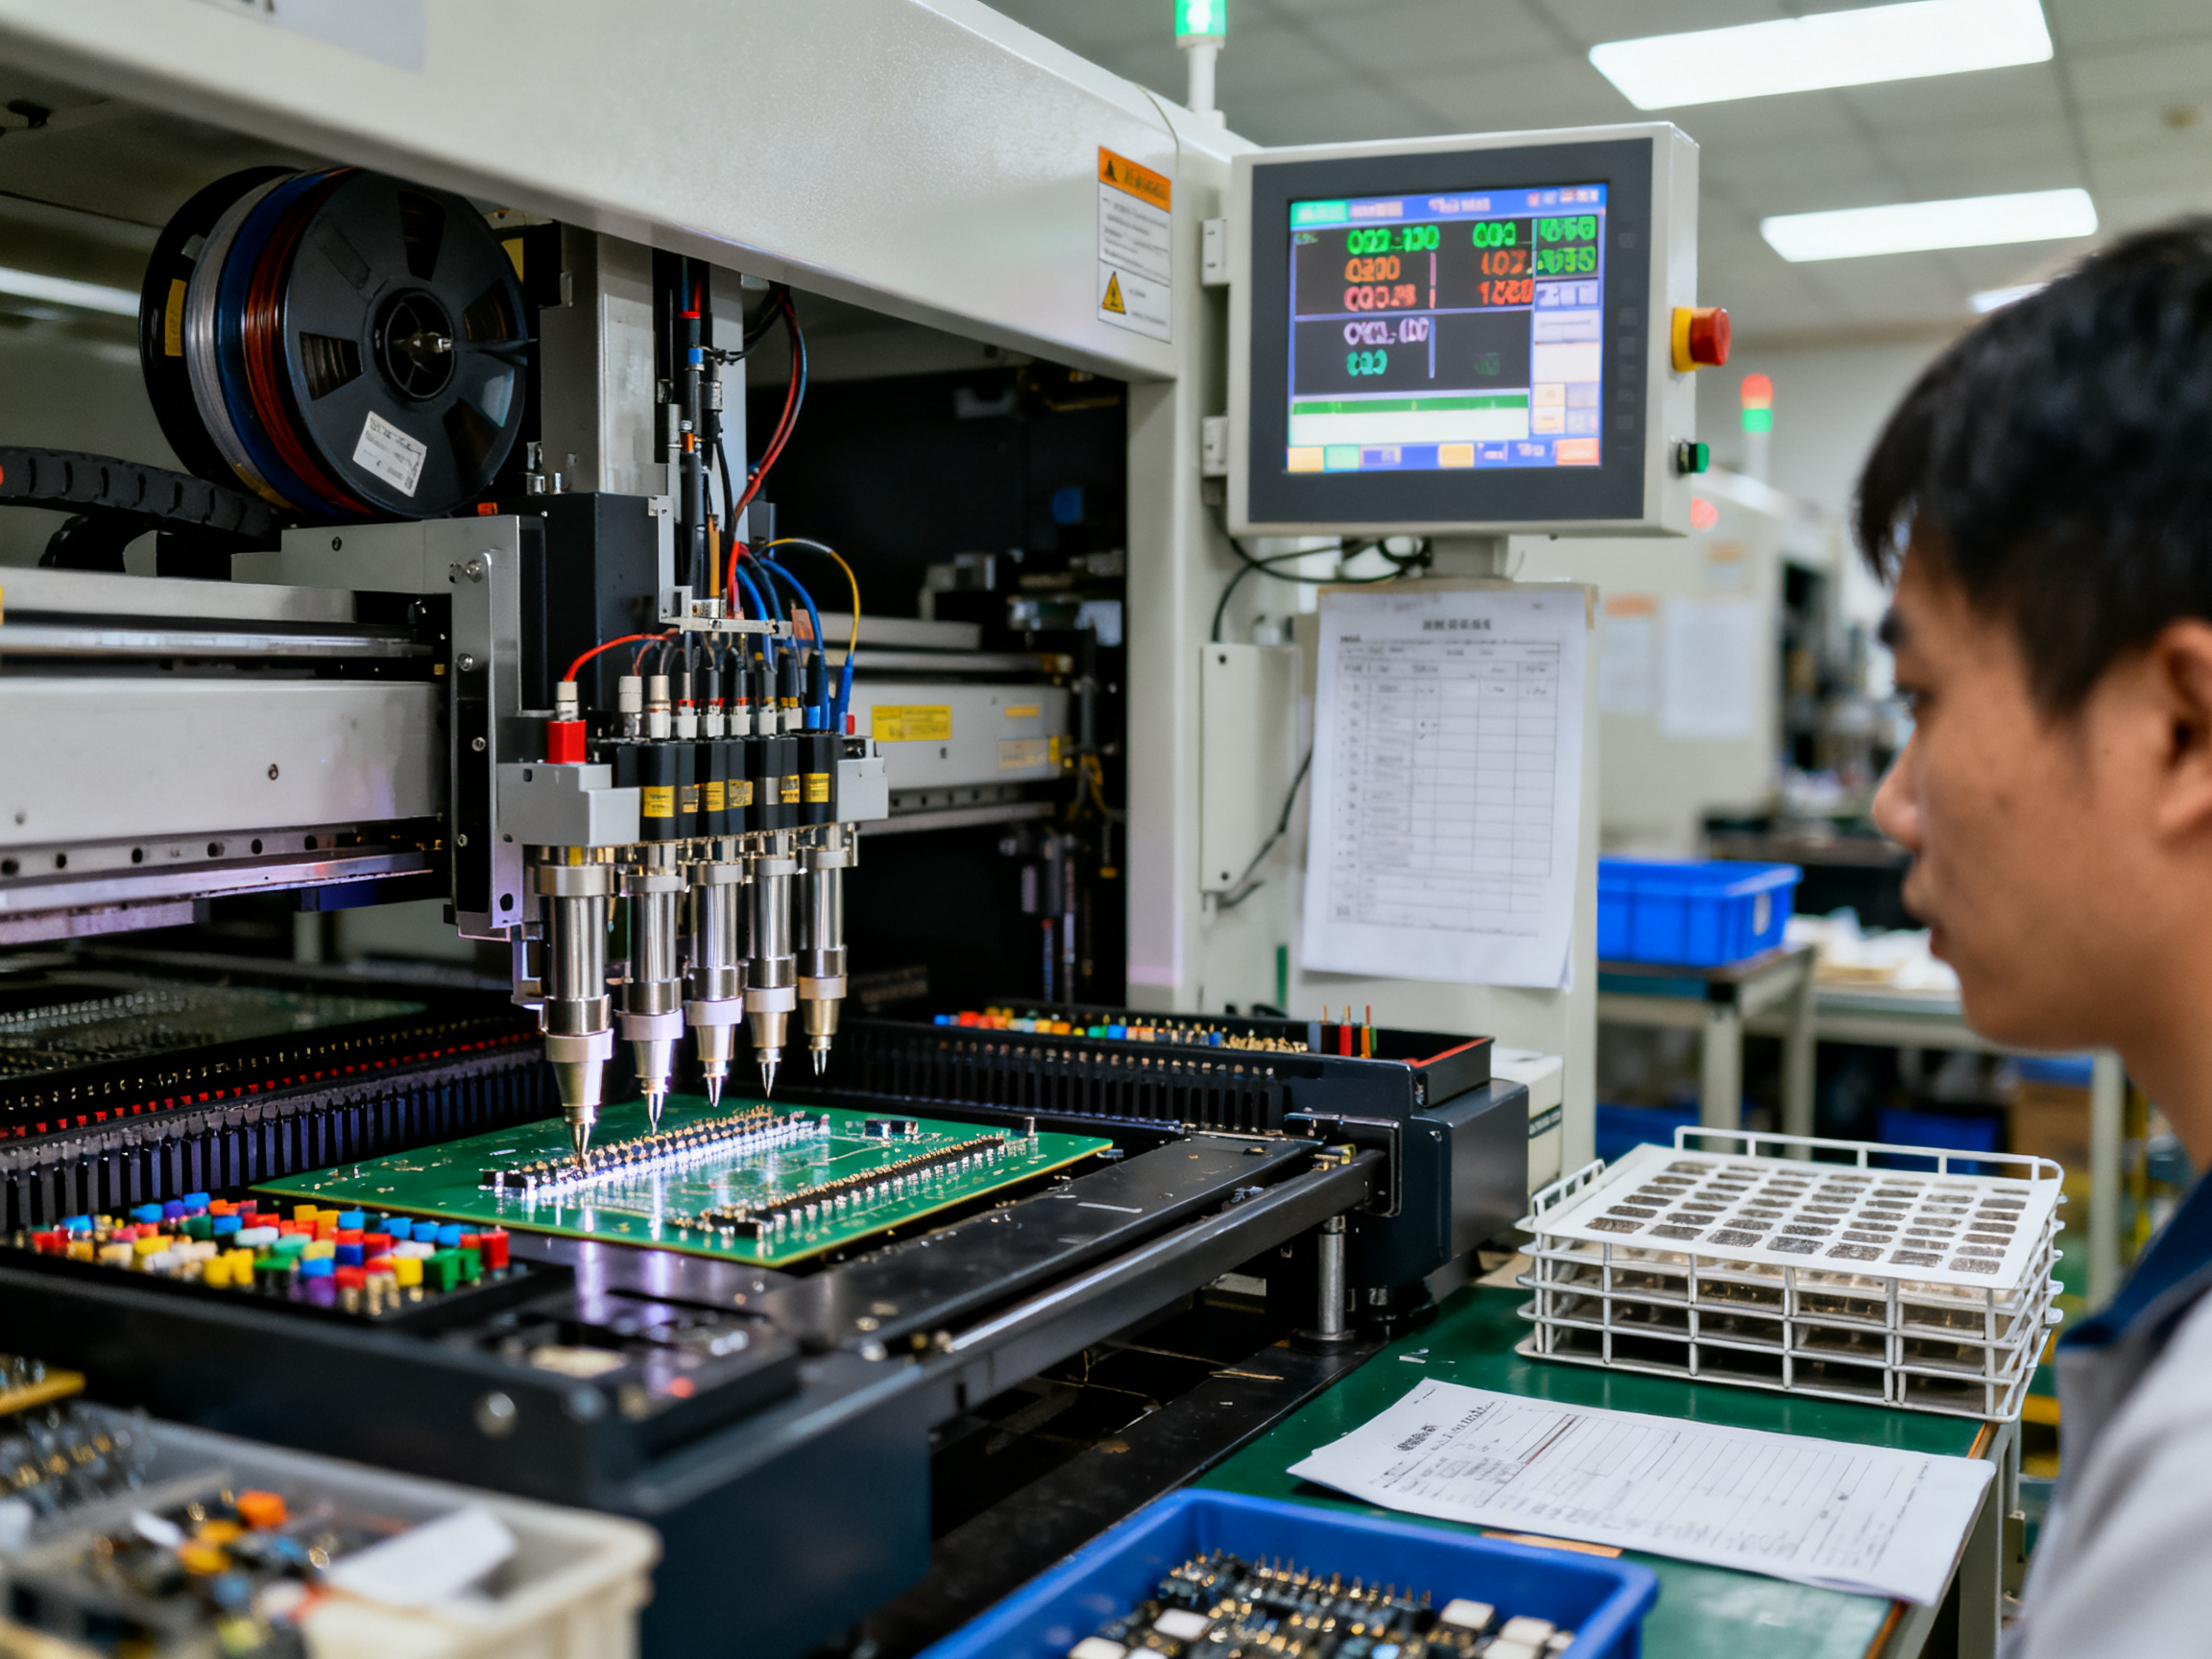
You’ll also need to account for feeder swaps, component shortages, and maintenance windows. If your optimization tool treats these as exceptions rather than normal operating conditions, it’s not built for reality.
From Our Experience: How to model changeover loss, feeder constraints, and reflow limits without overstating theoretical throughput
Simulation matters here too. Run what-if scenarios on your product mix before committing to a schedule. Push the belt speed too far to chase throughput numbers and you’ll trade line efficiency for defect callbacks. The best optimization tools show you the defect-risk tradeoff alongside the throughput gain, so you’re not optimizing one metric while destroying another.
The proof is in the pilot. Before trusting any software with your production data, run it against one product family for at least a week and compare actual output against what the model predicted.## Integration, Data, and Compatibility Requirements
Here’s something most vendors won’t tell you upfront: the software is only as good as what you feed it. If your machine data is messy, incomplete, or sitting in different systems that don’t talk to each other, even the smartest optimization engine will spit out bad recommendations.
Your speed matching tool needs clean data from multiple sources. Machine cycle times and real-time status from your printer, pick-and-place, and reflow oven. Product data including board dimensions, component lists, and reflow profiles. Defect history and first-pass yield numbers. Feeder inventory and maintenance schedules. Changeover logs. Downtime codes. If any of these are missing or trapped in spreadsheets, the software can’t do its job.
SMT integration standards matter more than vendors admit. In 2026, the practical stack is Hermes for machine-to-machine board handoff, CFX for equipment-to-system messaging, and SMEMA as a legacy fallback. OPC UA typically lives at the factory network boundary, not on the shop floor itself. Your software needs to speak these languages fluently or sit behind a gateway that translates for it.
Expert Tip: Minimum data set required before a vendor demo or pilot, including machine timing, product mix, and defect history
The most common reason optimization projects fail is bad inputs, not bad algorithms. Before you talk to any vendor, gather your actual machine cycle times, your product mix breakdown, and at least three months of defect history. Run a pilot without this foundation and you’ll get numbers that look good in the demo but fall apart on your actual line.
For MES and ERP connectivity, check whether the software can pull work orders, update production counts, and send traceability data back upstream. You want the optimizer and your production system speaking the same language, not working in silos.
Deployment and cybersecurity matter too. On-premises gives you data control but requires IT infrastructure. Cloud offers faster setup but raises security questions. Either way, your factory network needs proper OT segmentation, authentication controls, and logging. Modern reflow ovens from Chuxin Electronic Equipment and similar systems support standard protocols, which makes integration easier, but only if your broader infrastructure is ready to handle it.## How to Compare Software Categories and Build a Shortlist
Here’s the thing. Not all SMT optimization software is built the same, and the category you choose matters more than any individual feature. In 2026, the market breaks into three main buckets.
Stand-alone optimization tools focus purely on line balancing and throughput. They’re the fastest to deploy but need manual data entry or separate integration work.
MES modules are production management systems with optimization built in. More powerful but require bigger commitment and longer implementation timelines.
Vendor-specific suites come from equipment makers like ASMPT or Panasonic. They work great with their own hardware but can lock you into one vendor ecosystem.
| Category | Best For | Strengths | Limits |
|———-|———-|———–|——–|
| Stand-alone tools | Independent evaluation, mixed-vendor lines | Fast deployment, flexibility | Needs manual data feeds |
| MES modules | Full production management, traceability | Complete integration, scale | Higher cost, longer rollout |
| Vendor suites | Matched equipment, single-vendor sites | Deep integration, support | Potential lock-in, limited flexibility |
When you compare options, look at production mix first. High-mix lines need smarter sequencing logic than volume-focused tools. Then check integration depth with your printer, placement, reflow, and inspection systems. Finally, decide how much automation you actually need versus how much your team can handle manually.
The shortlist process is straightforward. Start with one line, one product family, and one KPI target. That’s it. Run a pilot. Measure the baseline before and after. If you can’t hit your target in 60 to 90 days with clear ROI, the software will not magically fix it at scale.
Pro Insight: Pilot scope, baseline metrics, and payback measures for the first 60 to 90 days
Most vendors will show you polished demos with perfect data. Your job is to run it against your actual line with your actual products. Compare what the model predicted against what your operators actually saw. That gap tells you everything about whether the tool is worth your money.## Common Mistakes in Implementation
Here’s where things get messy. You can buy the best SMT throughput optimization software on the market, throw money at implementation, and still end up with the same throughput numbers you started with. Why? Because the mistakes that kill optimization projects are rarely technical. They’re human.
Mistake number one: using incomplete cycle-time data. I’ve seen teams feed software with nameplate specs instead of actual measured times. One study found that observed cycle times ran 2 to 3 times longer than simulated values. If your model thinks your pick-and-place head can place 40,000 components per hour but it’s actually doing 28,000 because of nozzle changes and feeder swaps, your entire line model is wrong. The fastest machine in your spec sheet does not define your line. The actual bottleneck does, and that takes real measurement, not assumptions.
Mistake two: chasing theoretical output while ignoring defects. This one gets people in trouble all the time. You push the belt speed up to hit those shiny throughput numbers on the dashboard. First-pass yield drops. Solder defects spike. Now your “optimized” line is producing more rework than finished boards. The defect rate tradeoff has to be part of the model, or you’re just moving waste faster.
Mistake three: buying the software but keeping the same daily planning habits. Teams invest in tools without updating how their operators work. In 2026, AI projects fail at a 76 percent rate in manufacturing, and most of those failures trace to leadership decisions rather than technical limitations. If your team keeps planning changeovers the old way, ignores the software’s recommendations, and reverts to gut feeling when things get busy, you’re not implementing anything. You’re just paying for expensive screen time.
| What Good Implementation Looks Like | What Kills Projects |
|————————————-|——————–|
| Measured cycle times across full shifts | Nameplate specs and assumptions |
| Defect rate tracked alongside throughput | Throughput numbers in isolation |
| Operators trained on new workflows | Software dumped on existing team |
| Changeover prep done offline | Changeovers eating production time |
| Pilot validated against actual output | “Trust the model” without testing |
The fix is simple but not easy. Measure before you model. Pilot before you scale. And treat the software as a tool that changes how your team works, not a magic button that fixes everything while you watch.
Implementation Roadmap and KPIs
Here’s how to actually roll this out without blowing up your production schedule. The sequence works best in four phases: baseline, pilot, validation, scale-up.
Baseline first. Spend a week measuring your actual throughput, not what your nameplate says. Track changeover times, line utilization, defect rates, and OEE across full shifts. This gives you something real to compare against later.
Then pilot on one line, one product family. Pick your highest-volume product that also has decent changeover frequency. Run the optimization software for at least two weeks. Measure everything again.
Validation comes next. Compare pilot results against your baseline. Did throughput actually move? Did changeover time drop? Did first-pass yield hold steady or improve? If the numbers match what the model predicted, you’re ready to scale.
Scale up gradually. Roll to additional lines or product families one at a time. Don’t try to optimize everything at once.
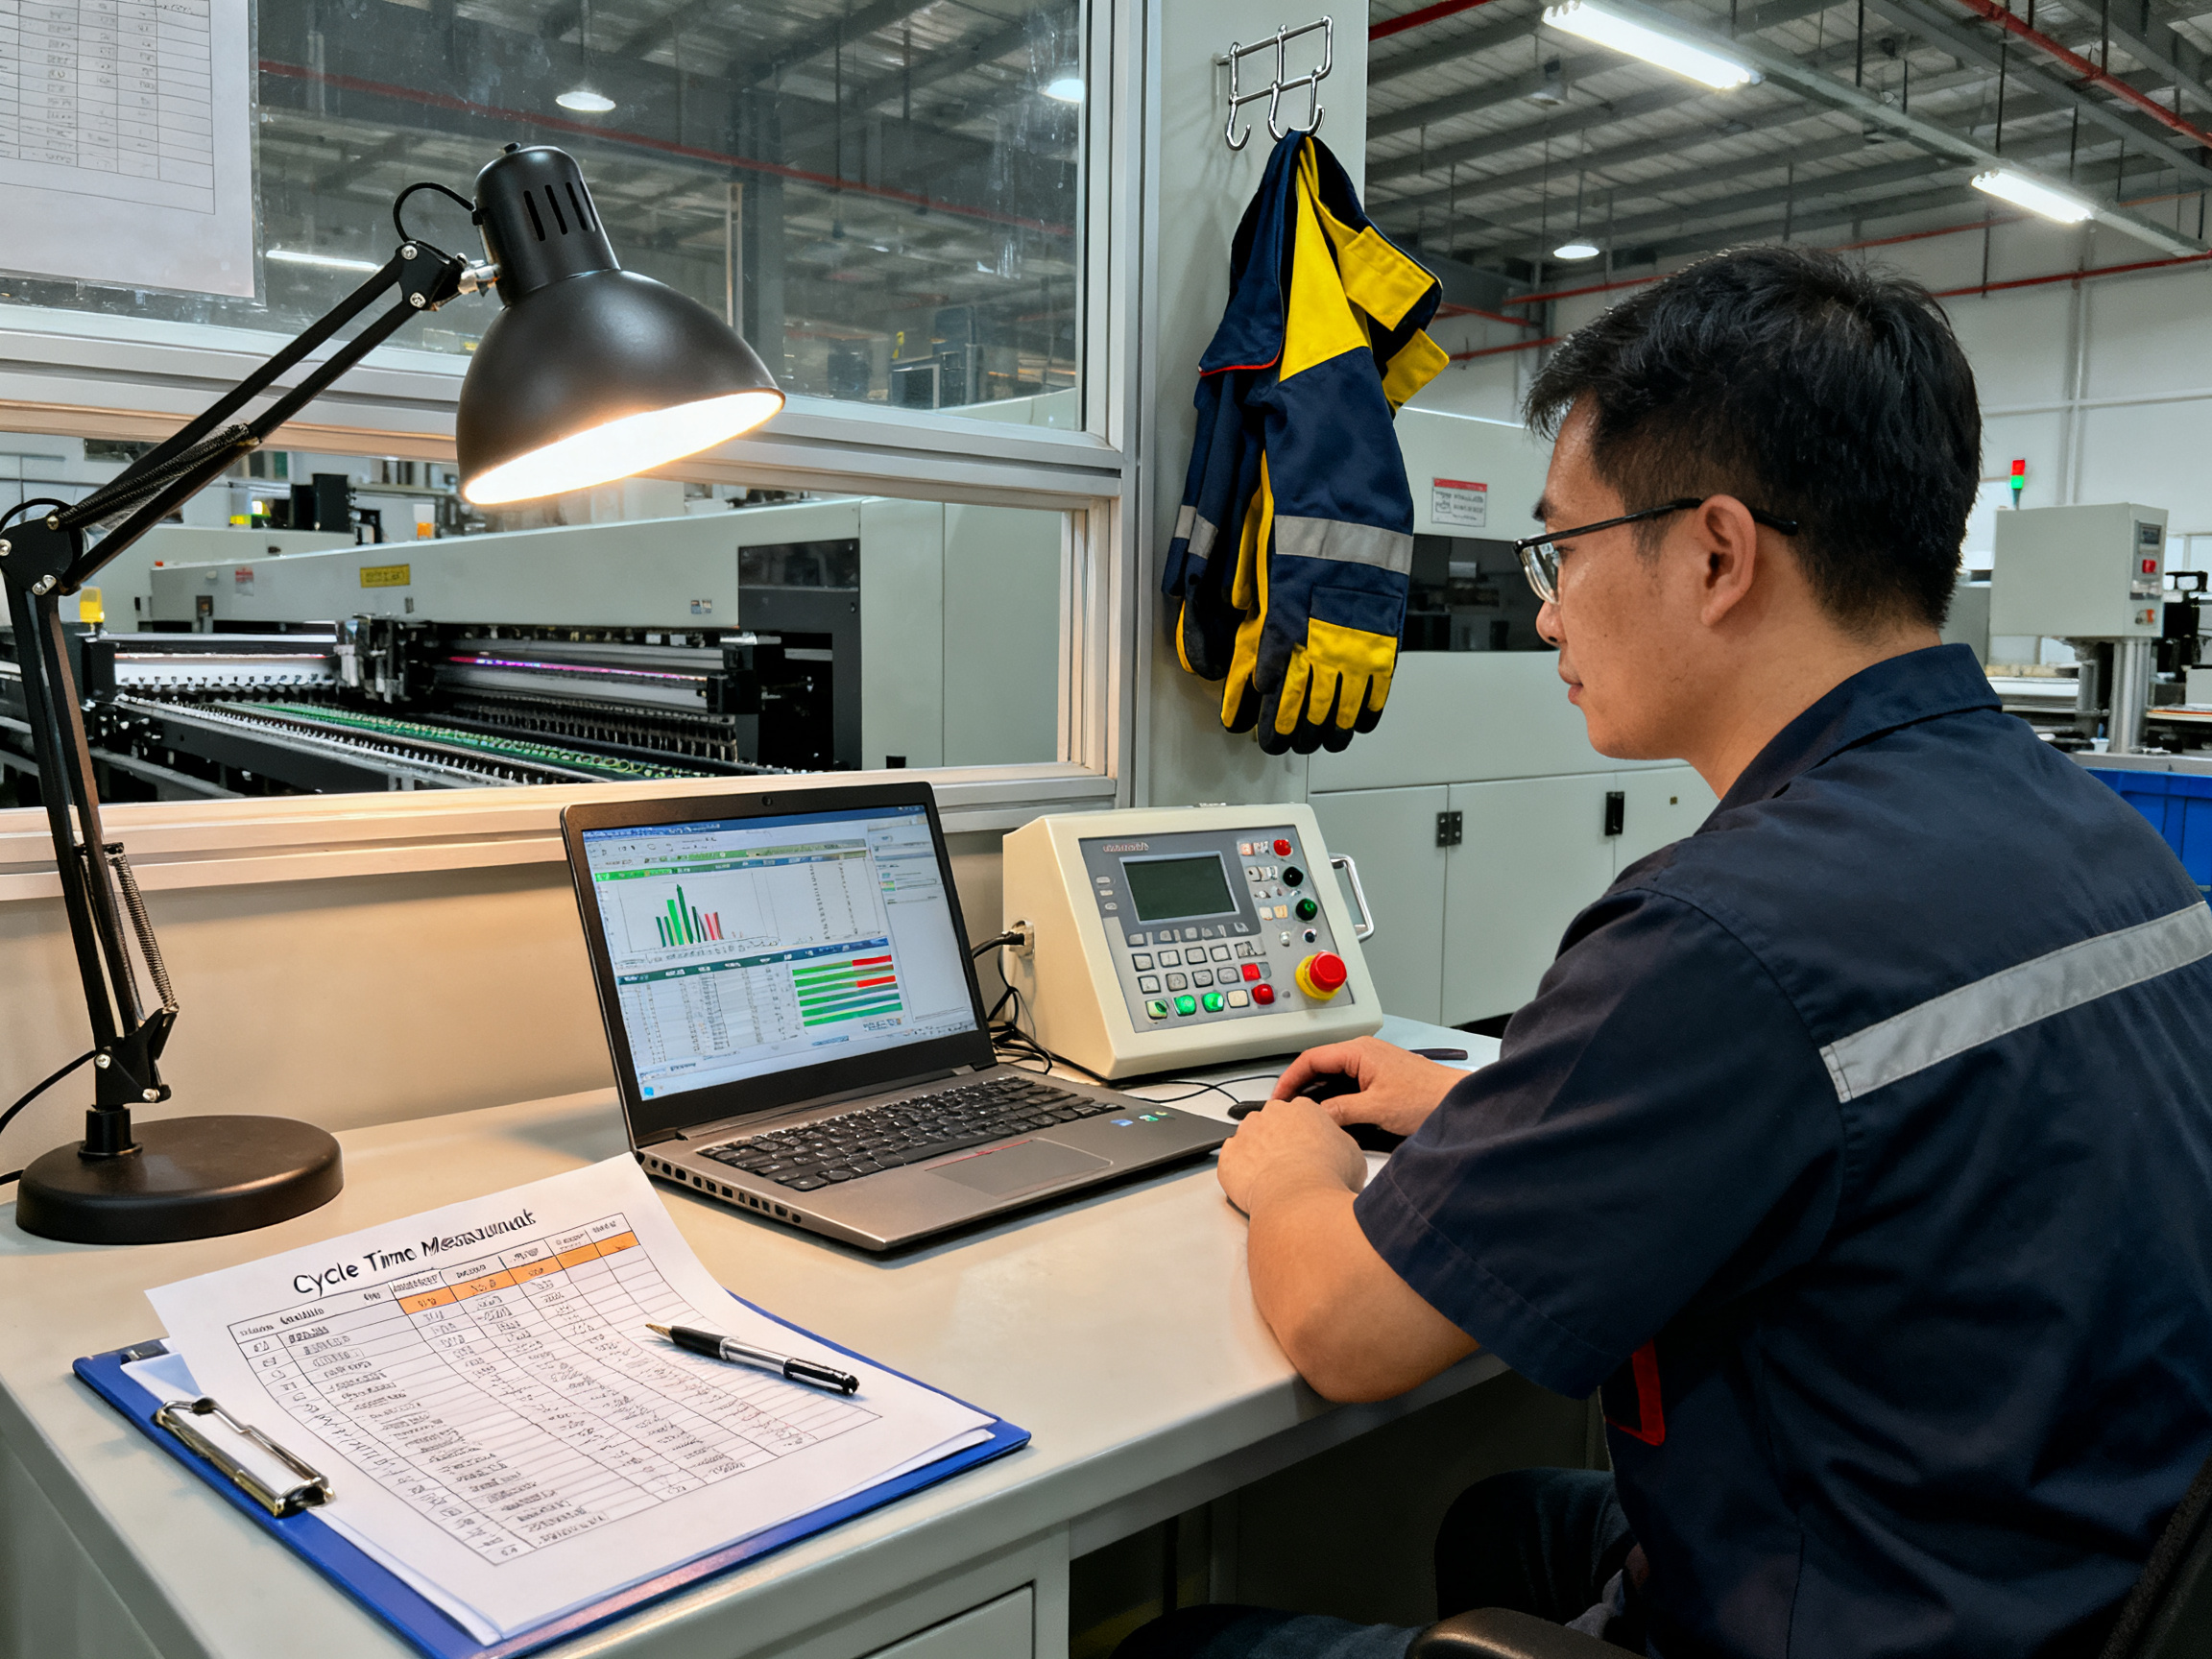
Pro Insight: Pilot scope, baseline metrics, and payback measures for the first 60 to 90 days
The KPIs that actually matter: throughput (boards per hour), line utilization (percent of time in productive work), changeover time, defect rate, and OEE. Track all five together. Looking at just one gives you a incomplete picture.
When you calculate payback, count incremental good units shipped, labor hours saved, and rework costs reduced. If you cannot show clear ROI within 90 days on a single line, the software will not deliver miracles at scale.
| Rollout Phase | Duration | Key Deliverable |
|—————|———-|——————|
| Baseline | 1 week | Actual performance numbers |
| Pilot | 2 to 4 weeks | Validated model accuracy |
| Validation | 1 to 2 weeks | Before/after comparison |
| Scale-up | Per line | Documented gains |
Keep it narrow. Prove it works. Then expand.## Conclusion: Choosing the Right Tool for High-Mix SMT Production
Here’s what it comes down to. The best SMT line speed matching software is not the one with the flashiest dashboard or the longest feature list. It’s the one that actually improves your throughput without creating new defect problems downstream.
When you’re evaluating options, keep three things in mind. First, check your data readiness. The tool is only as good as what you feed it, so clean machine cycle times, real product mix data, and defect history matter more than any algorithm. Second, verify integration fit with your existing equipment stack, whether you’re running a mixed-vendor line or something more standardized. Third, judge optimization depth. The software should model changeovers, feeder constraints, and reflow limits as part of normal operation, not as edge cases.
Your decision checklist:
- Have you measured actual cycle times across full shifts?
- Does the software model your product mix and changeover patterns?
- Is integration possible with your printer, placement, reflow, and inspection systems?
- Can it show you bottleneck rationale, not just bottleneck locations?
- Have you planned a pilot on one line with baseline metrics?
Start narrow. Prove it works on one real production line. Then expand.
For manufacturers evaluating SMT throughput optimization in 2026, the tools worth considering include ASMPT SMT Analytics for deep equipment integration, Panasonic NPM-DGS for placement-focused optimization, and TAKTIQ for high-variant assembly line balancing. Each serves different needs, so match the tool to your actual constraints, not your ideal scenario.