
Published: October 26, 2026
Last Updated: October 26, 2026
Reading Time: 16 minutes
Author: [Author name not provided, pending verification]
Technical Reviewer: [Reviewer not provided, add only after verification]
Category: SMT Process Engineering / Electronics ManufacturingEditorial Note: Every temperature range in this guide is a starting point, not a spec. Reflow profiles must be validated against your solder paste data sheet, component manufacturer limits, PCB construction, and oven type before they are used in production. Values from qualification or preconditioning standards are not production recipes.## Introduction: Why Reflow Temperature Control Determines SMT Quality
One bad reflow profile can take a line from 99% yield to 70% overnight. Cold joints, solder voids, tombstoning, head-in-pillow failures, cracked packages, and brittle intermetallics all trace back to heat that was too low, too high, too fast, or simply too inconsistent from one corner of the board to the other.
But here is the part that trips up newcomers: there is no single universal reflow temperature. Not one number that works for every alloy, paste, board, and component. The correct reflow temperature profile depends on your solder alloy, your paste datasheet, board thermal mass, component package limits, oven capability, and how fast the line has to run. That is why searching for “the reflow temperature” gets you a dozen conflicting numbers.
This guide walks through what a reflow profile actually is, the real temperature ranges for lead-free and leaded processes, how to measure them properly, how to optimize a profile that is not working, and how to troubleshoot the defects that show up in production.
Quick Answer: What is reflow temperature?
Reflow temperature is the temperature the solder joint must reach for the paste to melt and form a metallurgical bond. For Sn63/Pb37 eutectic paste, liquidus is 183 °C (361 °F). For SAC305 lead-free paste, liquidus is around 217 to 221 °C (423 to 430 °F). Peak joint temperature typically runs 230 to 245 °C (446 to 473 °F) for general lead-free work.Quick Answer: What is a reflow profile?
A reflow profile is a temperature-versus-time curve recorded during heating, soaking, and cooling. It shows ramp rate, soak time, time above liquidus (TAL), peak temperature, and cooling rate. It is measured with a thermocouple attached to the actual board, not read off the oven display.
Author bio: [Author name not provided, pending verification] is a [verified title or credential] with [verified experience] in SMT equipment, reflow soldering, or thermal profiling. One documented hands-on achievement or responsibility directly supporting this article’s technical scope must be added before publication. No author information was supplied, so this bio stays a placeholder until verified.
Related reading: IPC/JEDEC J-STD-020 defines moisture and reflow sensitivity classification for surface mount devices, which is where the classification temperature limits in this guide come from.## About the Author
Author bio placeholder: [Author name] is a [verified title or credential] with [verified years and focus] in SMT equipment, reflow soldering, thermal profiling, electronics manufacturing, or process quality. Before publication, add one documented hands-on achievement that directly supports this guide’s scope, such as ownership of a reflow profile qualification program, responsibility for oven commissioning or recipe development, or measured yield improvement tied to profile work. No author details were supplied for this draft, so the bio stays as a placeholder until credentials are verified.
This article’s temperature ranges, profile stages, and troubleshooting guidance were compiled from manufacturer technical data sheets, IPC/JEDEC and NASA workmanship standards, and thermal profiling practice. Every figure needs to be confirmed against your own paste datasheet, component limits, and oven before it goes into production.
A full author page with verified credentials will be linked here once the biography is confirmed. Readers can also check the primary standards referenced throughout, starting with J-STD-020.## 1. What Is Reflow Soldering, and How Does It Work?
Let’s start with the plain meaning, because “reflow soldering” sounds like jargon until you see what’s physically happening on the line.
Reflow soldering is the controlled heating of solder paste that has already been printed onto a PCB, so that the paste melts, wets the pad and the component lead or termination, and then solidifies into a permanent electrical and mechanical joint. That is it. No liquid solder pot, no soldering iron, no hand work on the board. The paste does the joining, and the oven does the melting.
When someone asks “what is reflow soldering in PCB production,” the answer is basically that: it is the standard way surface-mount components get attached to a board. And “what is reflow solder?” is a question that trips people up, because reflow is a process, not a material. The material is solder paste, which is fine solder powder suspended in flux, sometimes with a little chemistry added to control wetting.
Now, how does reflow soldering work? Here is the sequence on a modern SMT line:
- Paste printing. A stencil sits over the PCB, and a squeegee pushes solder paste through the apertures onto every pad that needs a joint.
- Component placement. A pick-and-place machine picks parts from reels or trays and sets them onto the paste deposits.
- Conveyor transport. The board rides a fixture or pallet through the reflow oven, moving at a set speed.
- Heating and flux activation. As the board passes through the early oven zones, the flux chemistry gets cleaned and activated, and the solder particles start to soften.
- Alloy melting and wetting. Once the joint passes the alloy liquidus, the solder becomes fully liquid, spreads onto the pad and the component termination, and forms the metallurgical bond.
- Cooling and solidification. The joint cools at a controlled rate and freezes into its final shape.
- Inspection. AOI, X-ray, or both check the result for voids, bridges, missing joints, and misplacement.
That third step, the conveyor moving the board through the reflow oven zones at a controlled speed, is where the whole “reflow temperature profile” conversation comes from. The oven has zones. Each zone has a setpoint. The board does not experience the setpoints; it experiences a curve that depends on how fast it moves, how much heat it is carrying, and how the oven is tuned.
Here is the process flow, end to end:
Paste printing → Placement → Conveyor → Reflow oven zones → Cooling → AOI / X-ray
   (stencil)      (pick & place)  (fixture)   (ramp → soak → peak → cool)
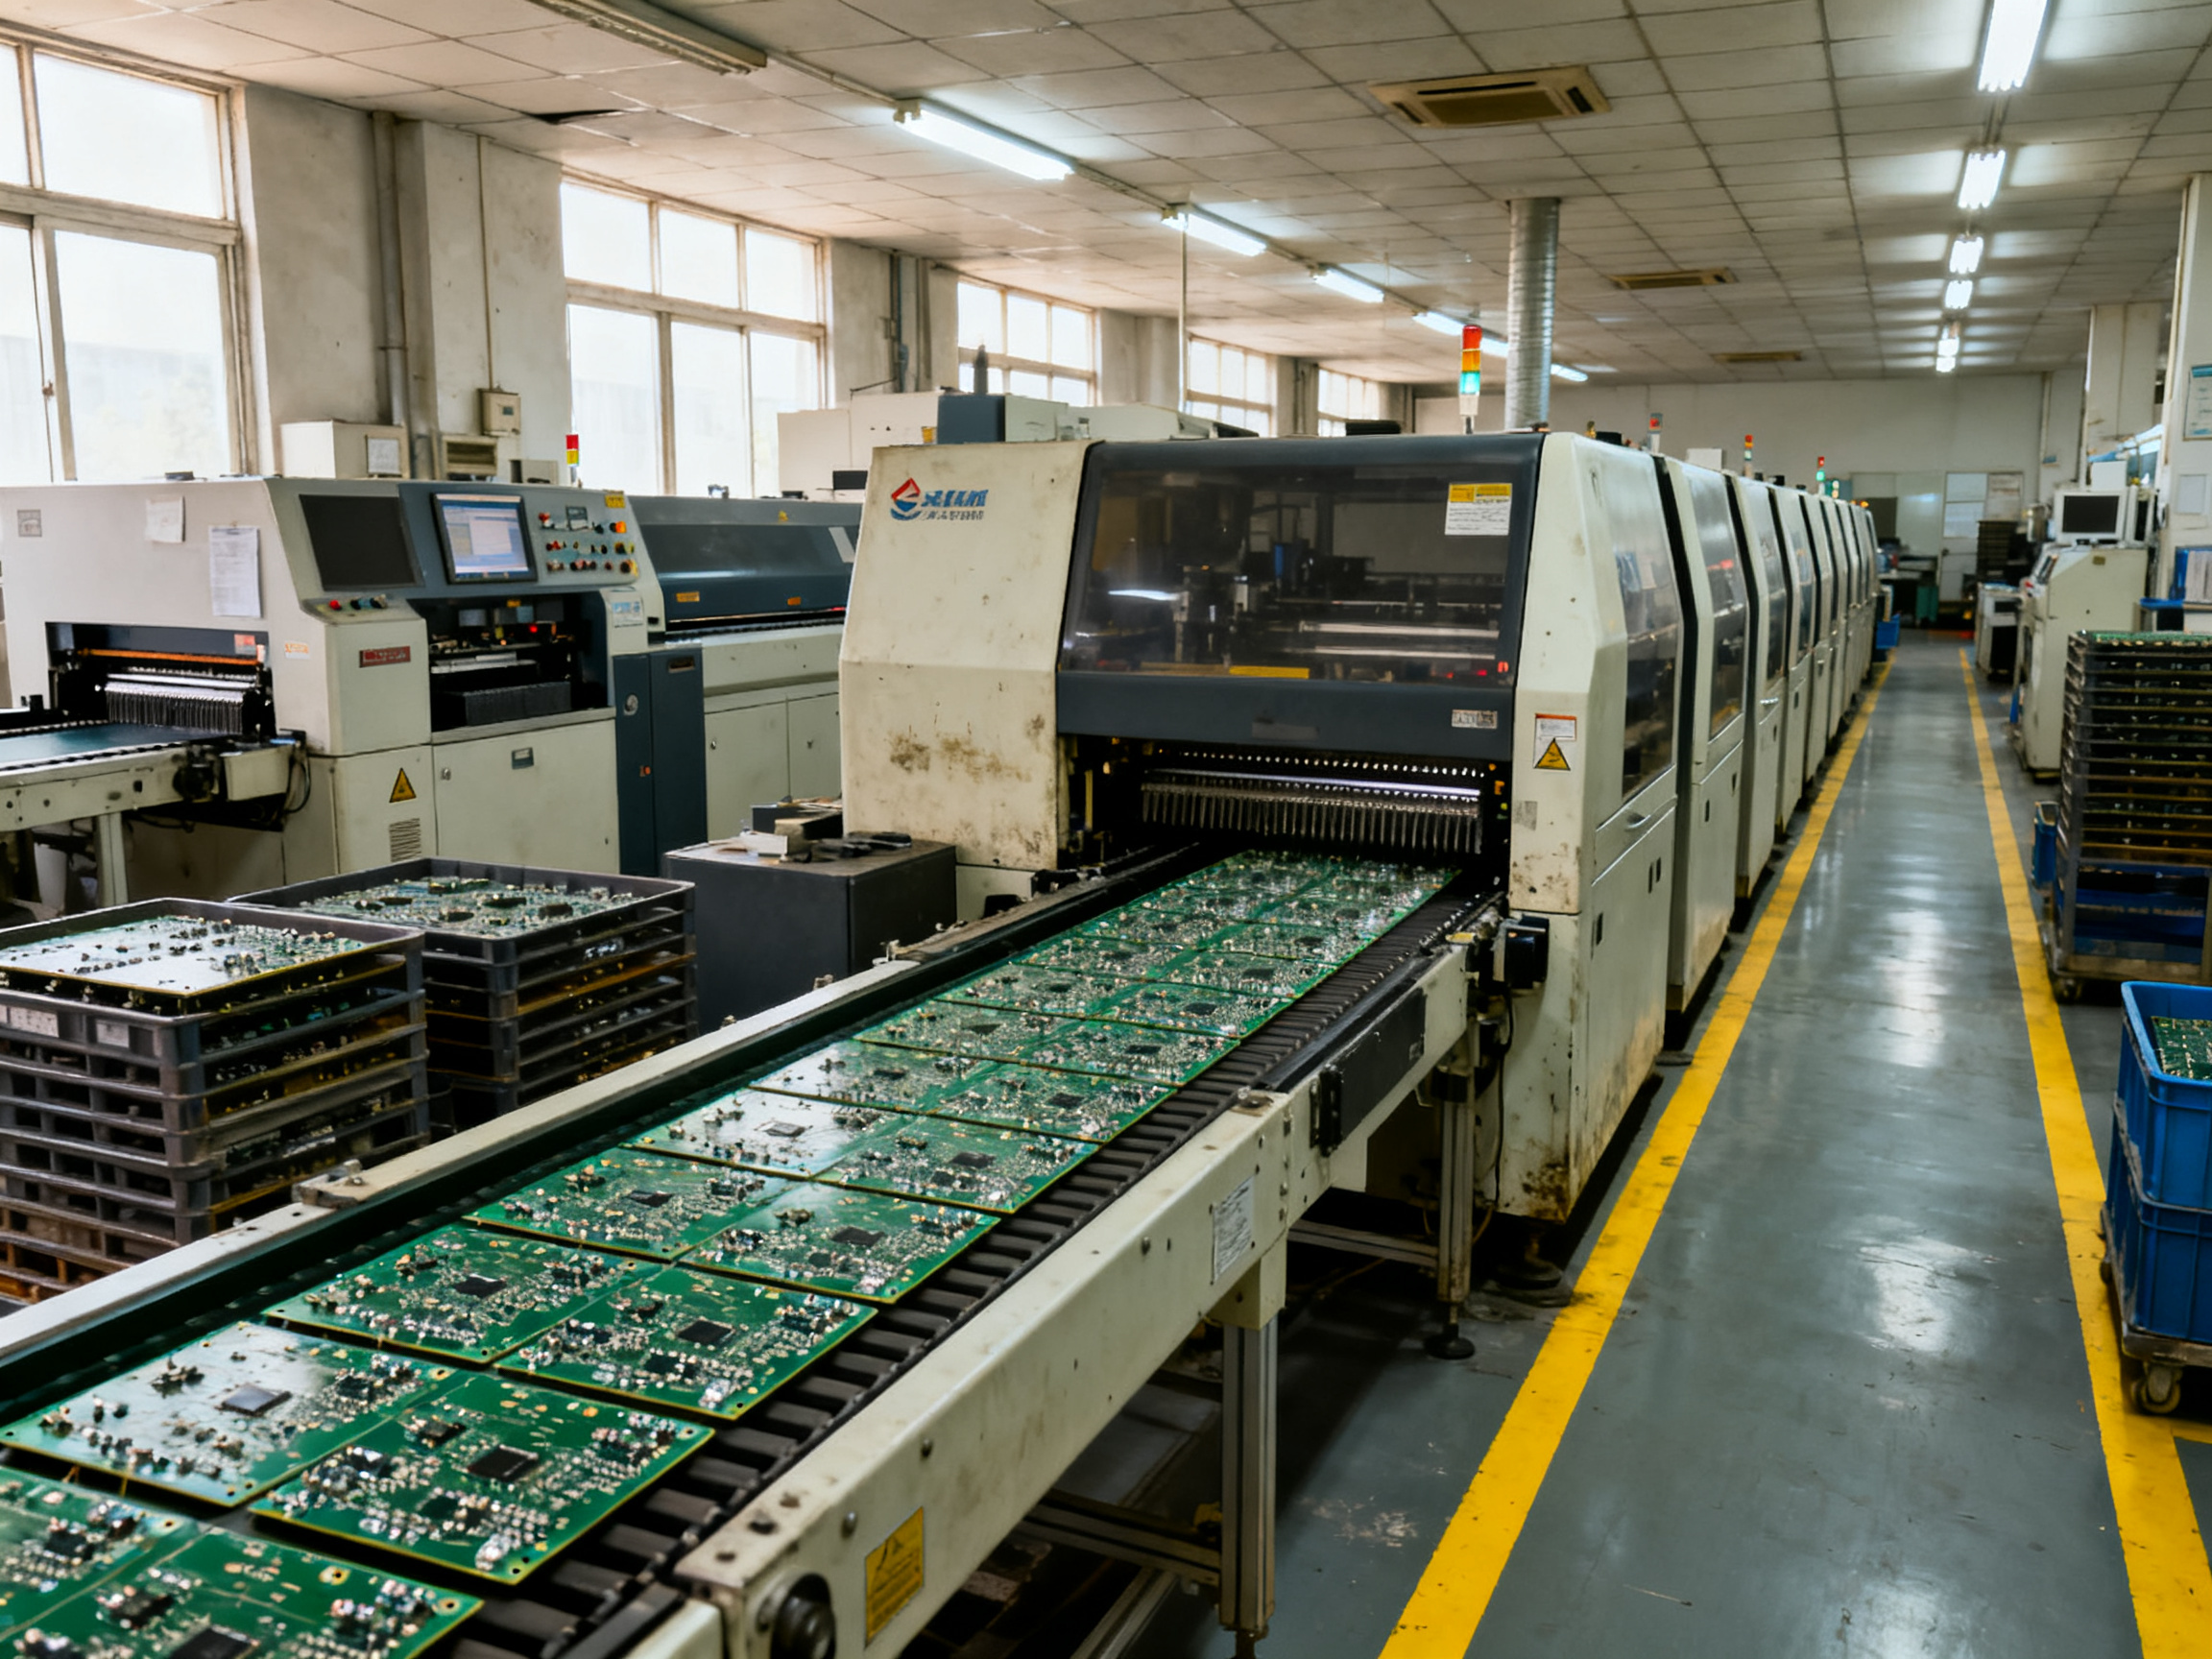
Now, what is reflow soldering used for? Surface-mount components. That covers most of what you see on a modern board: 0402 resistors, QFN packages, BGAs, connectors, LEDs. It is fast, because the entire board, every joint at once, gets heated together. A conveyor oven can process thousands of boards a shift.
But there are other ways to make joints, and mixing them up is a common source of confusion. Reflow, wave, and selective soldering are not interchangeable, and each one has its own sweet spot.
| Process | How the joint forms | Best for | Throughput | Watch out for |
|—|—|—|—|—|
| Reflow | Paste melts in place; all joints form together in the oven | Surface-mount components, fine pitch, BGAs | Very high | Voids, tombstoning, bridging, head-in-pillow, package cracking |
| Wave | Underside of the board contacts a moving wave of molten solder | Through-hole connectors, axial parts, bottom-side joints | High | Bridging, icicles, skips, shadowing |
| Selective | A nozzle applies molten solder to specific sites one at a time | Mixed technology, heavy connectors, tall parts | Lower, but efficient for varied work | Nozzle access, local overheating, dross |
A few practical notes on the differences. In mixed-technology boards, reflow usually runs first, forming every surface-mount joint. Then through-hole parts get added later by wave, selective, pin-in-paste, or manual soldering. NASA workmanship standards actually spell out wave controls in detail, including preheat, conveyor speed, wave height, and a solder wave temperature of roughly 249 to 274 °C in NASA-STD-8739.2. That is a wave pot, not a reflow profile, and the two numbers should never be confused.
Selective soldering is the answer when a board has one big power connector that would get destroyed in a wave, or when a handful of through-hole pins need joints that are impossible to reach otherwise. GSFC-STD-6001A covers requirements for area-array interconnects on flight hardware, which is a good example of how tightly mission work gets specified compared to general commercial production.
One more thing worth saying out loud, because it comes up in almost every training session: what “reflow temperature” refers to is the temperature of the solder joint itself, measured with a thermocouple attached to the board. It is not the number on the oven display. Those are different measurements, and the gap between them is where a lot of yield problems live. A zone setpoint of 250 °C does not mean the joint saw 250 °C.
And for anyone wondering how the standards fit together: J-STD-020 classifies packages for moisture and reflow sensitivity, J-STD-033 governs how you handle and store those packages, and J-STD-075 does the same job for non-IC parts like resistors, capacitors, and connectors. None of them is a board assembly recipe. Your paste data sheet and your component data sheets are what actually set the numbers.
Expert Tip: Profile the actual solder joints, not the oven zone setpoints. Put thermocouples on the coldest and hottest locations you can find on a real production board, including large ground connections and small parts on isolated planes, then validate at production line speed with a realistic load. The zone number is a target; the joint temperature is the fact.## 2. Understanding the Reflow Temperature Profile and Its Four Main Stages
A reflow profile is a temperature-versus-time curve, and it has four connected stages: preheat, soak, reflow (the peak and time above liquidus), and cooling. Here is the thing that trips people up. These stages are not four independent temperatures you dial in. They are one continuous thermal story, and each stage sets up the next.
Preheat and soak get the board ready. The reflow stage does the actual joining. Cooling locks the joint in. Get one wrong and the other three suffer.
Stage 1: Preheat
The board enters the oven cool. Preheat raises it toward the soak range at a controlled ramp rate, usually 1 to 3 °C per second. That upper limit matters more than most people realize. A fast ramp on a board with moisture trapped under a plastic package can pop the package apart, which is the classic “popcorn” defect. A slow ramp is safer for packages but wastes oven time and can dry the flux out before it does its job.
Stage 2: Soak
Soak is a temperature band, not a single setpoint. For lead-free work, 155 to 175 °C is common, held for roughly 60 to 100 seconds. ALPHA’s CVP-390 data sheet lists that soak range along with a time above liquidus of 45 to 90 seconds and a recommended ramp of 0.7 or 1.3 °C per second depending on assembly thermal mass.
What soak actually does is give the flux time to activate and spread, and let the whole board reach a uniform temperature. Uniformity is the real goal. If one corner is still climbing while another zone soaks, your board has a delta-T problem before you even reach the peak.
Stage 3: Reflow (Peak and Time Above Liquidus)
This is where the alloy melts and the joint forms. Two numbers define it: peak temperature and time above liquidus (TAL). For SAC305, liquidus sits around 217 to 221 °C, and peak joint temperature typically lands between 230 and 245 °C. For Sn63/Pb37, liquidus is 183 °C.
TAL is the number engineers under-record. It is how long the measured joint temperature stays above the alloy liquidus, and general guidance puts it at 30 to 90 seconds. Too short and the solder does not fully wet and reflow. Too long and you cook flux past its useful life and grow brittle intermetallics.
Stage 4: Cooling
Cooling sounds boring. It is not. Most paste vendors specify a cooling rate as a hard limit, because a joint that cools too slowly stays above liquidus longer than TAL suggests, and the grain structure suffers. Cooling also pulls components into alignment as solder solidifies, so a decent cooling rate helps against tombstoning and skew.
Annotated Profile
  °C
  250 |                    .---- Peak (230-245 °C lead-free)
      |                  .'  '.
  217 |                 /      '-.___  <- Liquidus (SAC305 ~217-221 °C)
      |               /             '--- TAL: 45-90 sec
  175 |            .-'                    \
      |          ./  Soak 155-175 °C        \
  100 |       .-'  60-100 sec               \
      |     .'   Ramp 0.7-1.3 °C/sec         \
   25 |____.'_________________________________  Cool 1-6 °C/sec
      +---------------------------------------------
        0    1     2     3     4     5    6     7   min
| Metric | What it means | Typical starting point |
|—|—|—|
| Ramp rate | Maximum heating slope | 0.7 to 3 °C/sec |
| Soak | Time between two defined temperatures | 60 to 100 sec at 155 to 175 °C |
| Liquidus | Temperature where alloy becomes fully liquid | 183 °C Sn63/Pb37, 217 to 221 °C SAC305 |
| TAL | Time above liquidus | 45 to 90 sec |
| Peak temperature | Maximum measured joint temperature | 230 to 245 °C lead-free |
| Delta-T | Spread between hottest and coldest thermocouple | Under 10 °C, ideally under 5 °C |
| Process window index | Margin between measured profile and spec limits | Higher is better |
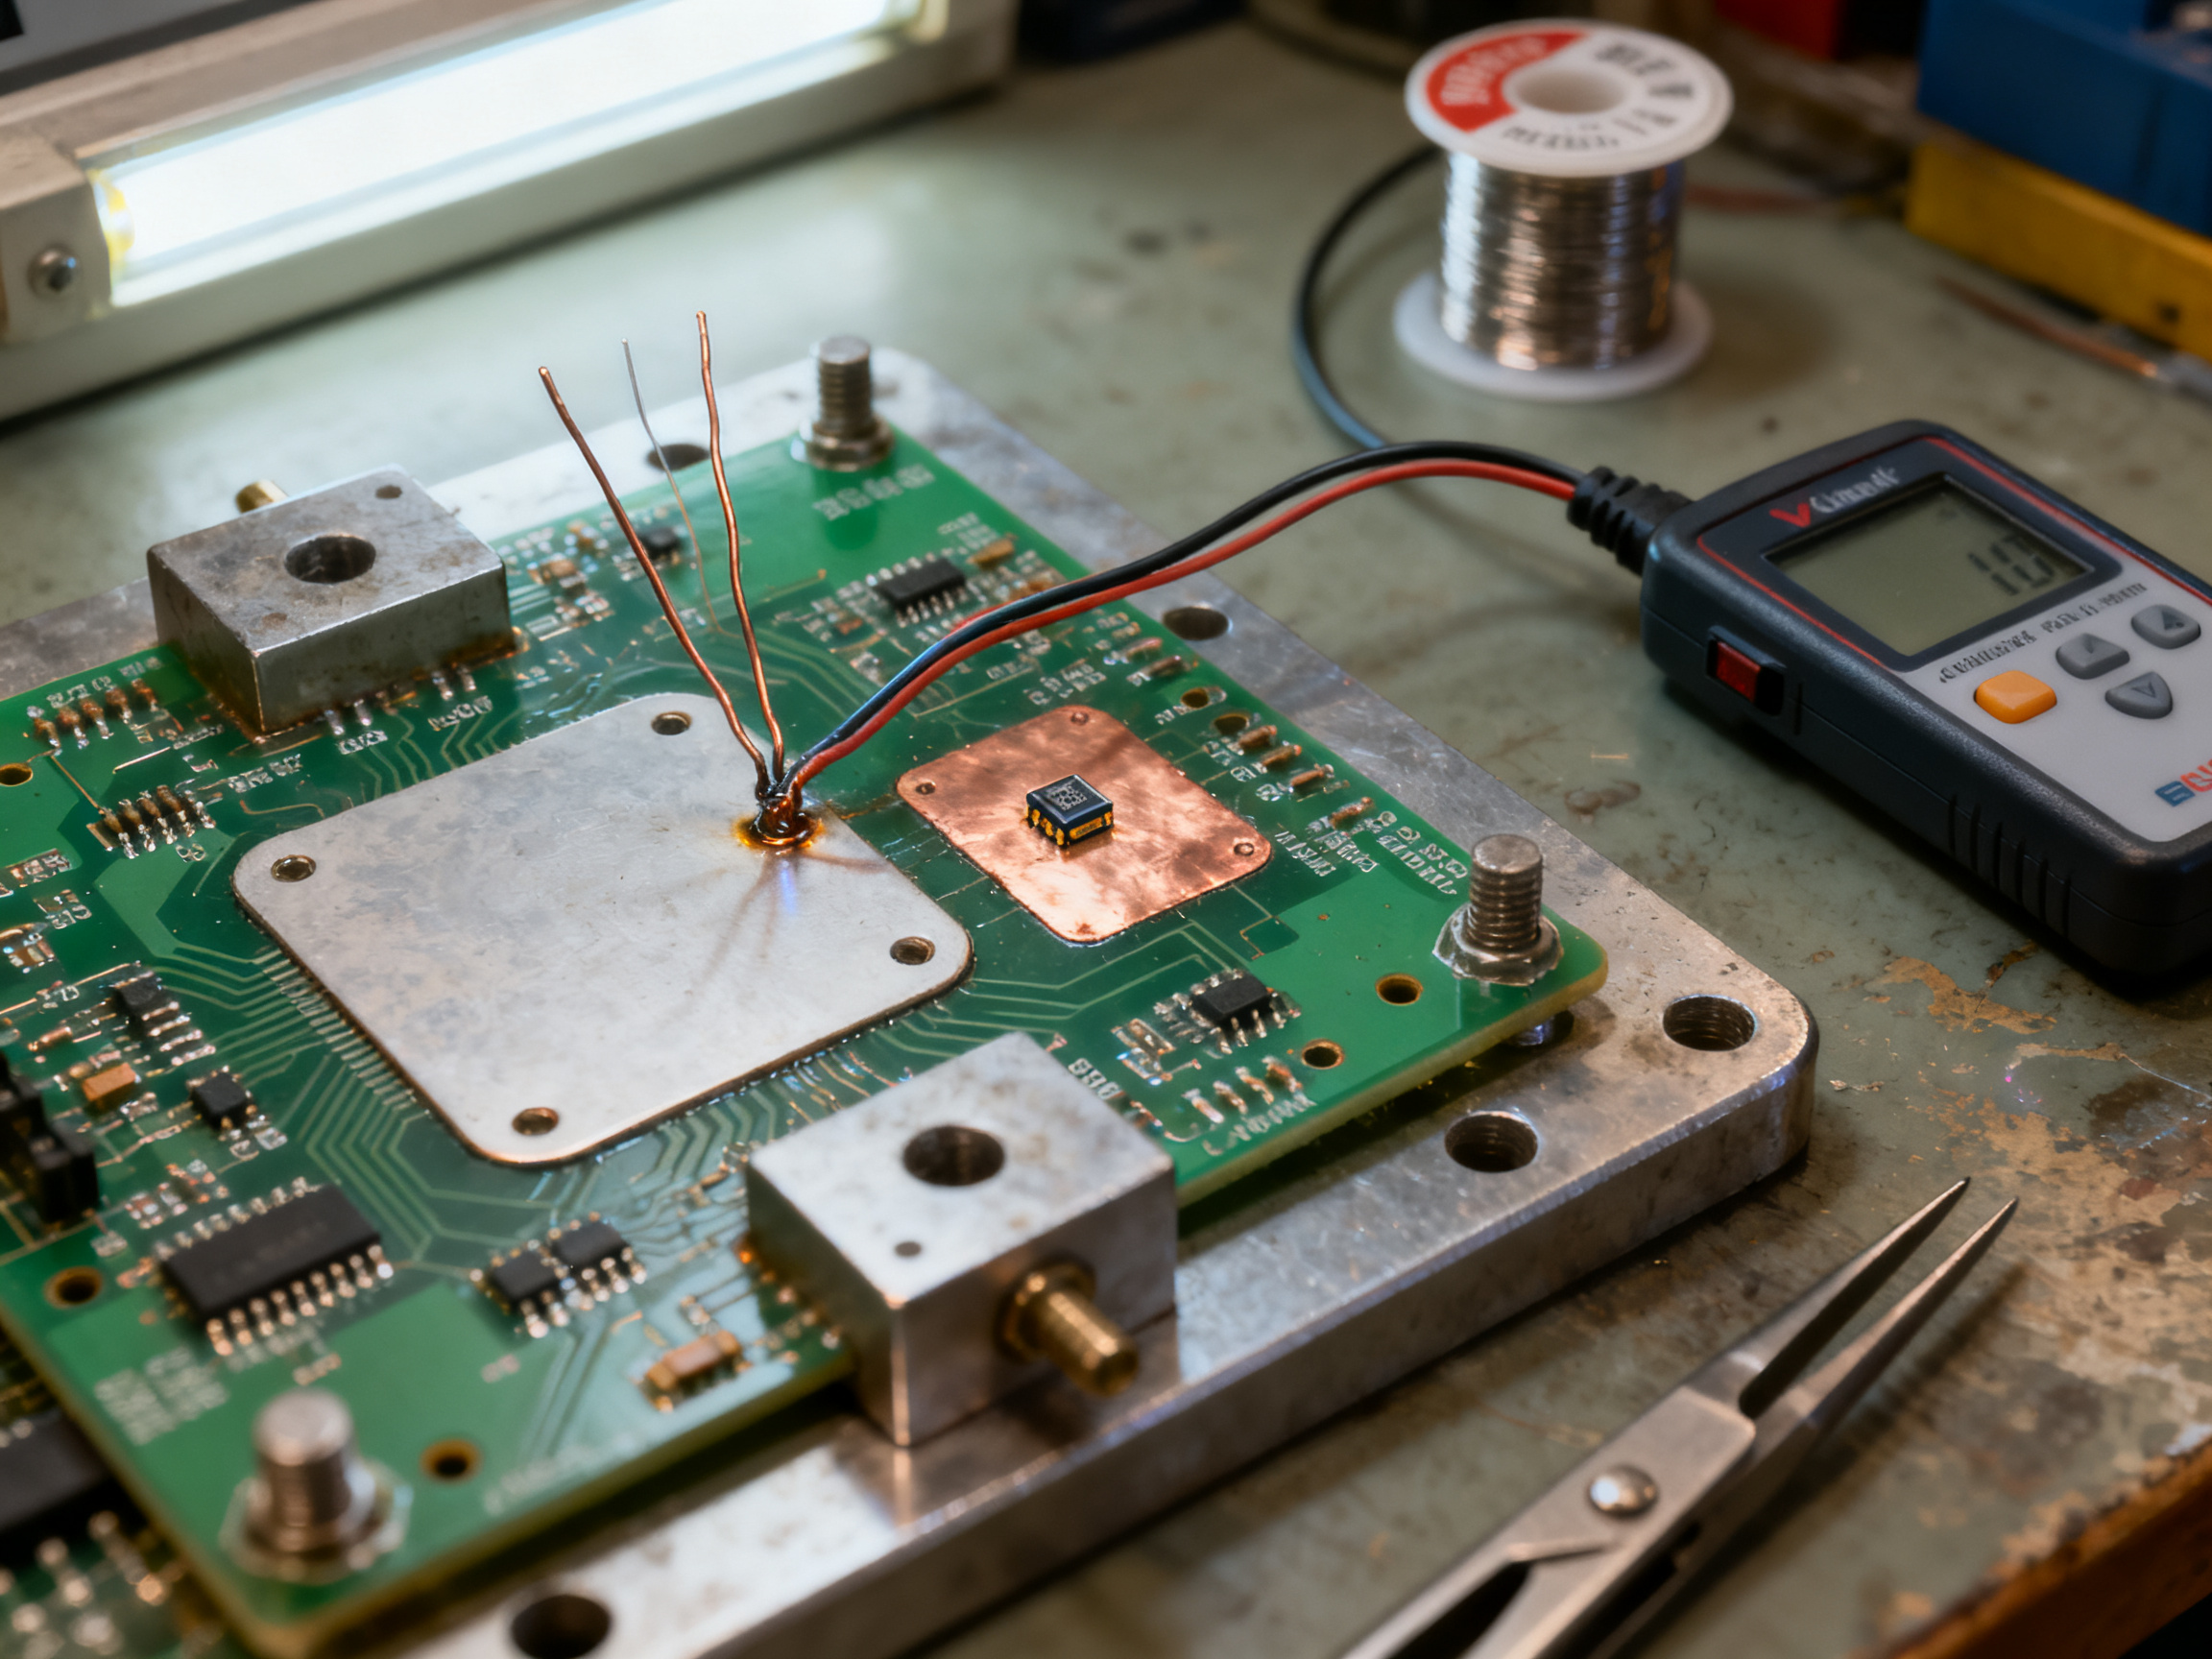
These values come from vendor guidance rather than a single standard, and AIM’s NC520 data sheet makes the point cleanly by offering both a ramp-to-spike and a ramp-soak-spike profile, with the longer one for high thermal mass boards. Different paste, different flux, different board. The curve is a system, not a recipe.
Once you can read the curve this way, picking actual temperature ranges becomes a much smaller problem.
Expert Tip: Profile the actual solder joints, not the oven zone setpoints. Put thermocouples on the coldest and hottest locations you can find on a real production board, including large ground connections and small parts on isolated planes, then validate at production line speed with a realistic load. The zone number is a target; the joint temperature is the fact.## Expert Tip #1: Profile the Assembly, Not Just the Oven
Expert Tip: Oven-zone setpoints and real solder-joint temperatures are not the same measurement. A zone reading 250 °C tells you what the controller commanded, not what your joint experienced. Attach thermocouples to representative hot and cold locations on a populated board, then validate at production line speed with a realistic load. The zone number is a target. The joint temperature is the fact.
Where to put the thermocouples:
| Measurement point | Representative location | Purpose |
| — | — | — |
| TC1 — hot spot | Large ground plane or other high-thermal-mass connection | Identifies the location most likely to run hottest |
| TC2 — mid-size joint | Joint near the board center | Tracks heating and cooling through the center of the assembly |
| TC3 — cold spot | Small component mounted on an isolated island | Identifies the location most likely to run coolest |
Attach at least one thermocouple to the joint you expect to run hottest, usually a large ground connection, and one to the joint you expect to run coolest, usually a small component on an isolated plane. Record both curves together with the zone setpoints. Where those two numbers disagree, the measured profile wins.
Attribution: [Insert verified author or reviewer’s first-hand profiling insight here, including the board type, thermocouple locations used, and the delta-T value observed.]## 3. Typical Reflow Soldering Temperature Ranges
So what temperature does solder reflow at? The short answer is: it depends on the alloy, and the alloy is chosen before the oven is ever turned on.
Here is the part that frustrates people searching for solder reflow temperature in Fahrenheit. There is no single number. A Sn63/Pb37 board and a SAC305 board do not share a reflow temperature, and a low-temperature bismuth paste has a whole different window again. What you can do is build a solid starting range from the alloy, then verify it on your own boards.
Four temperatures people mix up
Before the table, get these straight, because mixing them up is the source of most bad profile work:
- Melting point and liquidus. The melting range of the alloy. Liquidus is the temperature where the alloy is fully liquid. This is the number that defines time above liquidus.
- Oven zone setpoint. What the controller is commanding in a given zone. This is a target, not a measurement.
- Measured solder joint temperature. What a thermocouple attached to the joint actually reads. This is the number that matters for ramp, TAL, peak, and cooling validation.
- Component maximum body temperature. The ceiling the component manufacturer sets for its package body. Sometimes it is lower than the paste’s recommended peak, and when that happens, the component wins.
A 250 °C zone setpoint does not mean the joint saw 250 °C. Sometimes it is close. Sometimes it is off by 30 degrees in either direction.
Alloy comparison
| Alloy family | Liquidus | Preheat and soak guidance | Time above liquidus | Typical peak range | Major cautions |
|—|—|—|—|—|—|
| Sn63/Pb37 (tin-lead eutectic) | 183 °C / 361 °F | Soak roughly 150 to 180 °C / 302 to 356 °F | 30 to 60 sec | Roughly 215 to 230 °C / 419 to 446 °F | No current official paste data sheet was located for a specific product, so treat the peak as a starting guess and pull the real window from your TDS. Lead is a restricted substance; check RoHS and REACH obligations for your market |
| SAC305 (Sn99Ag0.3Cu0.5) | 217 to 221 °C / 423 to 430 °F | Soak 155 to 175 °C / 311 to 347 °F for 60 to 100 sec | 45 to 90 sec | 230 to 245 °C / 446 to 473 °F | Higher melt point means more heat into the board. Watch component body limits and thermal mass. Peak range depends on oven type |
| SAC305, vapor phase profile | 217 °C / 423 °F | Ramp to 150 °C / 302 °F, progress through 150 to 175 °C | Time above 217 °C measured and controlled | 230 to 245 °C / 445 to 474 °F | These values come from a vapor phase oven context. Do not copy them unchanged into a convection profile |
| Low-temperature bismuth pastes (for example Sn42/Bi58 family) | Around 138 °C for this alloy family, but chemistry varies | No generic values; use the paste data sheet only | Paste specific | Paste specific | Brittle alloys, often incompatible with lead contamination, and a different rework story. Never reuse SAC305 settings here |
Two vendor sources are worth keeping on your desk. MacDermid Alpha’s CVP-390 data sheet gives SAC305 at 217 to 221 °C liquidus, soak of 155 to 175 °C for 60 to 100 seconds, time above liquidus of 45 to 90 seconds, cooling of 1 to 6 °C per second, and straight ramp rates of 0.7 or 1.3 °C per second. The same document notes the paste can withstand 250 °C during reflow, which is a withstand statement, not a recommended joint peak.
AIM’s NC520 data sheet does something smart: it offers both a ramp-to-spike profile and a ramp, soak, spike profile, and recommends the longer one for high thermal mass boards. Same alloy, different board, different curve.
Warning: never treat these as universal settings.
Every range in the table above is a starting point for profile development, not a production recipe. Your solder paste data sheet is the primary process reference. Component manufacturer limits, PCB construction, oven type, atmosphere, line speed, and board load all have to be validated on real assemblies before the profile goes live.
The Fahrenheit shortcut
If you are working in Fahrenheit, the conversions are not hard to remember once you see them a few times:
- 150 °C = 302 °F
- 175 °C = 347 °F
- 183 °C = 361 °F
- 217 °C = 423 °F
- 221 °C = 430 °F
- 230 °C = 446 °F
- 245 °C = 473 °F
- 250 °C = 482 °F
The formula is simple: multiply Celsius by 9, divide by 5, add 32.
Where the ranges come from in practice
In 2026, most production lines running lead-free work are targeting a peak joint temperature of 230 to 245 °C, which is 446 to 473 °F, with time above liquidus in the 45 to 90 second band. Lead-free reflow temperature demands more attention than the old tin-lead process did, mostly because the alloy sits higher and the board absorbs more energy along the way.
If your line is still running legacy tin-lead, or you are moving an oven toward lead-free capability, it is worth looking at how the machine itself is configured. Lead-free reflow ovens with multi-zone ramp control, nitrogen capability, and recipe storage can take a lot of the guesswork out of profile development, and Chuxin Electronic Equipment (S&M Co. Ltd.) builds exactly this kind of lead-free reflow oven and full SMT line for high-density consumer, semiconductor, and military assembly work. The machine matters, but the joint measurement is what proves it.
One last practical note on lead-free reflow temperature windows. High-melting-point alloys hit copper pads harder, so dry-out and oxidation on the board surface become more common. If your peak is solid but your joints look dull and grainy, the problem may be flux and atmosphere rather than temperature. And if components are cracking, check body temperature against the J-STD-020 classification limit before you blame the peak.
Next, in Section 4, we get into profiling the actual board, which is where these numbers stop being theoretical.## 4. How to Build and Validate a Reflow Profile for a Real PCB Assembly
Building a reflow profile is not guesswork. It is a sequence of decisions, and each decision has a paper trail. The engineers who get good results are not the ones with the faniest ovens. They are the ones who can explain, months later, why zone 4 sits at 240 °C and the conveyor runs at 85 cm per minute.
Here is the workflow that works.
Step 1: Collect the constraints before you touch the oven
Start with the documents, not the recipe. Pull three things:
- The solder paste data sheet. This gives you liquidus, soak band, ramp, TAL, cooling, and peak guidance for your exact flux chemistry. ALPHA’s CVP-390 data sheet is a good example of what a usable TDS contains, including a 45 to 90 second TAL window and a 1 to 6 °C per second cooling limit.
- The component data sheets. Look for maximum body temperature and reflow cycle limits. J-STD-020 classification sets the ceiling, and the manufacturer can set something lower.
- The board stack-up. Copper weight, layer count, and how much ground plane sits under your parts tell you how much heat the assembly absorbs.
From Our Experience: Change one process variable at a time, and keep a traceable recipe history for every change. We once adjusted two zone setpoints and conveyor speed together, and the resulting peak looked good. It also pushed the smallest component into a thermal void that did not exist in the baseline. Now we change one thing, log it, and re-profile before touching anything else.
Step 2: Find your likely hot spots and cold spots
Hot spots usually sit on large copper. Think big ground planes, big connectors, mounting pads tied to chassis ground, power components with heavy leads, and shielded parts with metal bodies. Cold spots sit on small components over sparse copper, especially small passives on isolated islands, and fine-pitch parts such as QFNs where the pad area is tiny.
| Assembly feature | What it does to the profile |
|—|—|
| Large ground plane or chassis connection | Runs hottest, defines peak |
| BGA or QFN on thermal vias | Vias pull heat away, often runs cooler than expected |
| Heavy power connector | Adds mass, lags behind on ramp and cool |
| Small 0402 on an isolated island | Runs coolest, often the real limit |
| Metal-can or shielded part | Body temperature ceiling, watch for cracking |
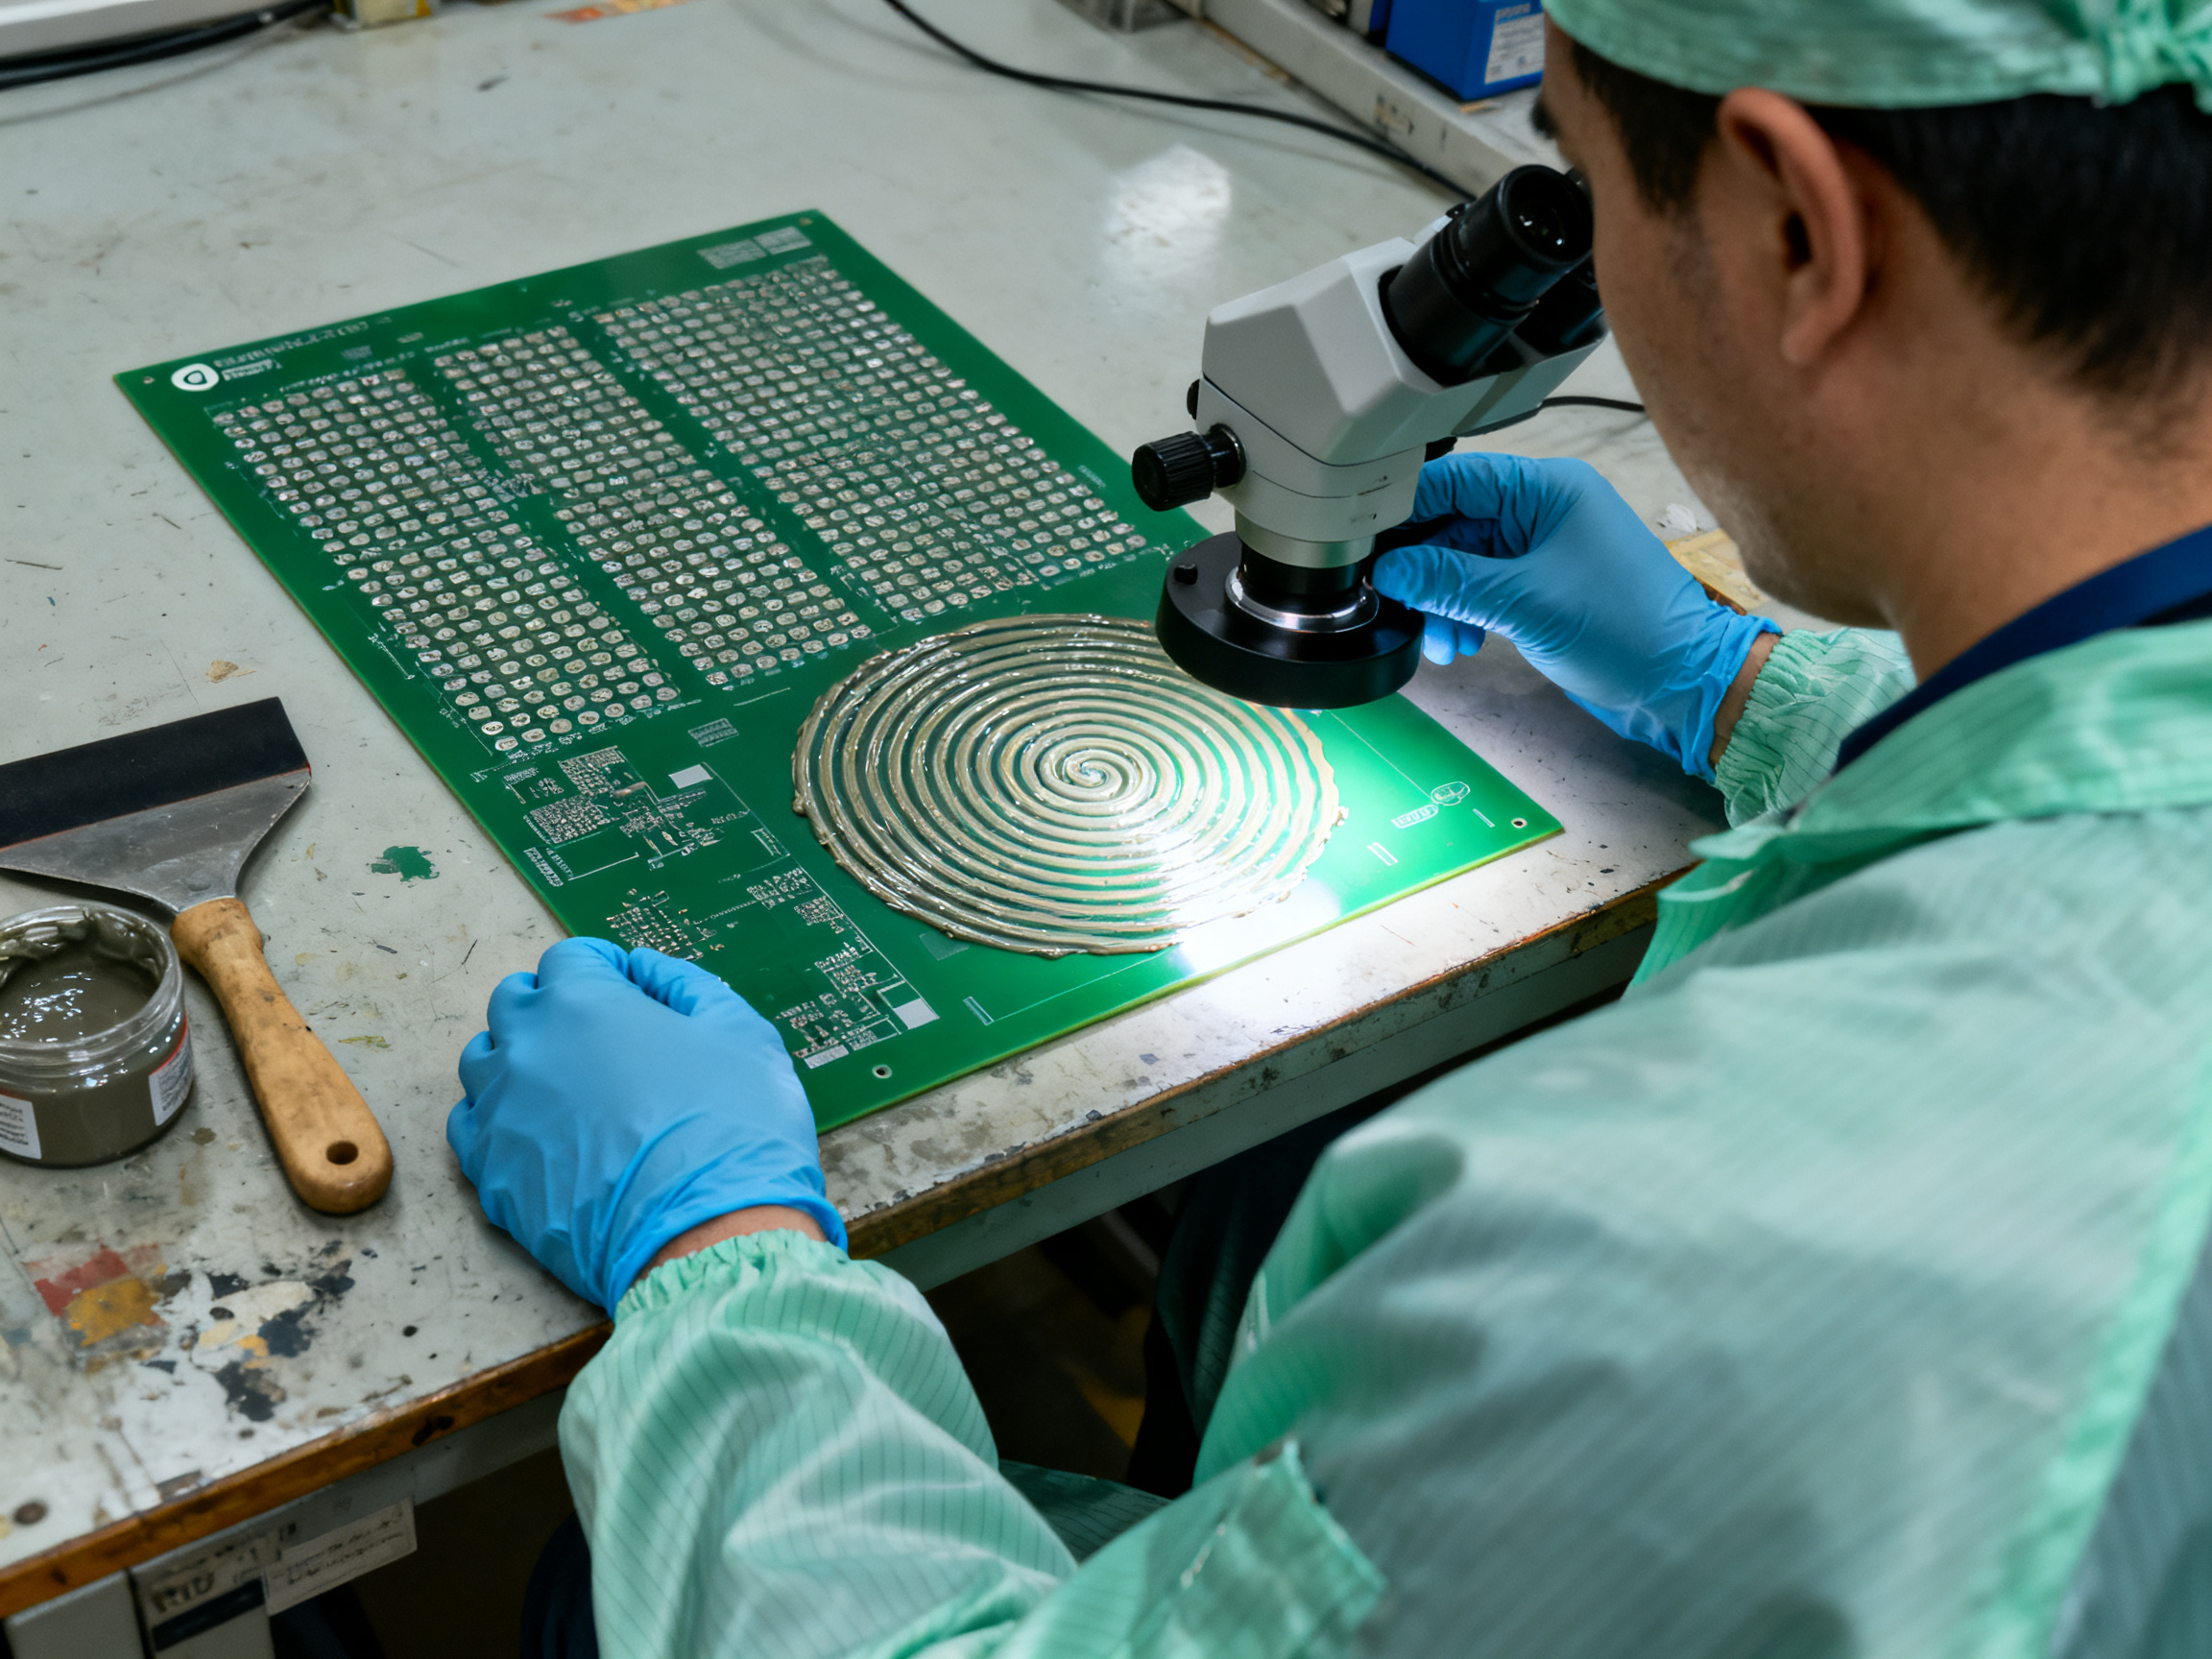
Step 3: Run a baseline and record everything
Start from the paste vendor’s suggested profile and let it run. Log the zone setpoints, the conveyor speed, the oven type, the atmosphere, the board load, and the pallet spacing. Record the thermocouple curves on the same worksheet so the numbers sit next to each other.
Step 4: Compare against the process window
Now check each metric against the TDS limits and note the margin. This is where most people stop reading and start guessing. Build the comparison table instead.
Step 5: Adjust zones and conveyor speed carefully
Zone temperature, conveyor speed, airflow, board load, and line spacing all talk to each other. Speeding up the conveyor shortens every stage at once, including TAL and soak. Slowing it does the reverse. Raising an early zone setpoint can lift the peak without touching the peak zone at all, because the board carries that heat forward.
Here is a simple decision tree:
Ramp too fast?      → lower zone 1-2 setpoints or slow conveyor
Soak too short?     → widen zone 3 band, slow conveyor slightly
Peak too low?       → raise reflow zone setpoint, watch component limits
TAL too short?      → raise peak zone setpoint or slow conveyor
TAL too long?       → lower peak zone setpoint, improve cooling fan
Cooling too slow?   → increase cooling fan output, check airflow balance
Delta-T too wide?   → rebalance zone setpoints, check board load and spacing
Step 6: Validate repeatability
Run the same board at the same line speed, three times, with a realistic load. If your peak moves more than 5 °C between runs, the profile is not stable yet. Fix repeatability before you validate capability.
Warning: qualification profiles are not production profiles. Manufacturer application notes often publish profiles meant for preconditioning and reliability testing. Qorvo’s solder reflow guidance says plainly that these may not match your assembly process, so use them as a sanity check, not a recipe.
Profiling Worksheet
| Metric | Measured TC hot | Measured TC cold | Target | Pass or fail | Action |
|—|—|—|—|—|—|
| Ramp rate | | | 0.7 to 3 °C/sec | | |
| Soak time at band | | | 60 to 100 sec | | |
| Peak temperature | | | 230 to 245 °C | | |
| TAL | | | 45 to 90 sec | | |
| Cooling rate | | | 1 to 6 °C/sec | | |
| Delta-T | | | Under 10 °C | | |
| Repeat run 2, 3 | | | Within 5 °C | | |
Before and After
Before (baseline, too fast and too cold)
  °C
  250 |
      |                /\
  217 |               /  \___  <- TAL only 22 sec
  175 |             /
      |          ./  Soak only 40 sec
      |       ./
   25 |______/
      +----------------------------- time

After (one variable changed: conveyor speed)
  °C
  250 |                /\
      |              _/  \__
  217 |            _/        \__  <- TAL 61 sec
  175 |          _/  Soak 82 sec
      |        _/
   25 |______/
      +----------------------------- time
Attribution: [Insert verified author or reviewer case data here: board type, paste, thermocouple locations, before and after peak, TAL, delta-T, and measured yield change.]
Ovens with multi-zone ramp control, recipe storage, and nitrogen capability cut down the trial-and-error loop a lot. Shenzhen Chuxin Electronic Equipment’s lead-free reflow ovens and SMT lines are built for that kind of high-density work. Still, the machine is only half the answer. The measured joint curve is the other half, and it is the half that goes in your logbook.
One more thing before you sign off a recipe: check floor life. If moisture exposure or baking enters the picture, Allegro’s handling and storage guidance points back to the J-STD-020 and J-STD-033 requirements, and baked parts may need their own profile review.
Next, in Section 5, we look at what high thermal mass packages like BGAs and QFNs do to all of this.
From Our Experience #2: Change One Process Lever at a Time
From Our Experience: Change one process variable at a time, and keep a traceable recipe history for every change. We once adjusted two zone setpoints and conveyor speed together, and the resulting peak looked good. It also pushed the smallest component into a thermal void that did not exist in the baseline. Now we change one thing, log it, and re-profile before touching anything else.
Here is what a compact change log looks like in practice:
| Date | Variable changed | Board / paste | Peak measured | TAL | Delta-T | Defect result |
|—|—|—|—|—|—|—|
| Baseline | None | Control board, SAC305 | 238 °C | 41 sec | 8 °C | 2 voids on QFN, yield 97.1% |
| Rev 2 | Conveyor speed only | Same | 239 °C | 62 sec | 6 °C | Voids cleared, yield 99.4% |
| Rev 3 | Peak zone setpoint | Same | 245 °C | 68 sec | 7 °C | No change, reverted |
One lever per row. Same board, same paste, same load. Now you know which knob did the work.
Attribution: [Insert a verified case or observation from the author’s actual SMT work, including board type, paste, and the measured result.]## 5. Lead-Free Reflow Temperature Challenges for High-Density Assemblies
Here is the honest part about lead-free: the alloy sits about 40 °C higher than tin-lead, and that extra heat has to go somewhere. It goes into the component body, into the laminate, into the solder mask, and into the connectors. So the window between “enough heat to form a good joint” and “too much heat for the part” gets tight. On a leaded line, you might have 20 to 30 °C of room. On a dense lead-free board running SAC305, sometimes you have 10.
That is why lead-free reflow temperature work in 2026 is less about hitting a number and more about knowing where the limits sit on your specific assembly.
Where high-density boards break
BGA and QFN packages fail quietly. You cannot see the joint. A QFN with a lifted or partially collapsed lead still passes an electrical test on the bench, and then fails in the field. X-ray inspection is not optional here; it is the only way to know what happened inside the package.
The failure modes worth knowing:
- Head-in-pillow (HIP), where the ball or lead wets only one side and looks like a pillow instead of a sphere. Usually a TAL or wetting problem, often on boards with big copper balances.
- Voiding, which comes from outgassing, trapped flux, or misplaced thermal vias. Lead-free pastes with higher solids content tend to trap more gas.
- Tombstoning and skew, where one end of a small component pulls up during cooling.
- Uneven collapse and warpage, on large BGAs with asymmetric copper, which is a board design issue as much as a thermal one.
| Package or board feature | Thermal challenge | Likely defect | Measurement method | Mitigation |
|—|—|—|—|—|
| BGA on large thermal-via array | Vias pull heat away, so the part lags the board | Long TAL, voids, head-in-pillow | Profile on the ball, plus X-ray | Reduce via-in-pad tenting, extend soak, add X-ray check |
| QFN with a large ground pad | Runs hotter than surrounding parts | Tombstoning, uneven collapse | Thermocouple on the pad edge | Extend soak, verify paste volume, check placement skew |
| 0402 chip part on isolated island | Runs coldest on the board | Insufficient wetting, dull grain | TC on the smallest joint | Slow the peak zone or reduce local delta-T |
| Heavy connector or power device | Thermal mass, slow ramp and cool | Dry joints, incomplete fill | Two TCs, one at the lead | Extend TAL, consider a preheat ramp |
| Thin high-layer-count laminate | Delamination risk at high soak | Blistering, warpage | TC on board surface, cross-section check | Hold soak inside the paste TDS window |
| Epoxy or connector with tight temperature limit | Component limit below paste peak | Cracking, discoloration | Body thermocouple against the data sheet | Build the profile around the component limit |
From Our Experience: On dense BGA and QFN assemblies, we treat the package body limit as the governing number, not the paste peak. If your component data sheet caps body temperature below what the paste recommends, the component wins every time. The other thing that catches people is asymmetric copper. A board with a heavy ground pour on one side and a sparse plane on the other will not collapse evenly, and no amount of peak temperature tuning fixes that.
Evaluating the extra tooling, honestly
When density climbs, shops start looking at nitrogen, vapor phase, vacuum-assisted reflow, and tighter cooling control. Each has real benefits. None is automatically required.
- Nitrogen reduces oxidation and can keep joint surfaces brighter. It is product-specific though; some flux chemistry and some pastes are designed for air. Requirements like an oxygen level at or below 1000 ppm come from specific paste suppliers, not from a general rule.
- Vapor phase gives excellent temperature uniformity with minimal part-to-part variation, but it constrains board geometry and costs more to run.
- Vacuum-assisted reflow reduces voiding directly by lowering pressure around the joint. It is usually worth it for large BGAs with tight void limits, and rarely worth it for a board of small passives.
- Advanced convection and cooling control help with thermal mass spread and warpage, which no gas or vacuum system solves on its own.
The test is always the same: does the defect data justify the equipment? If voids are your main problem, X-ray plus a stencilled vent pattern may beat a bigger oven. If delta-T across the board is the problem, better airflow and zone tuning may do more than nitrogen ever will.
Ovens with multi-zone ramp control, nitrogen capability, and recipe storage give you more levers to pull for dense work, and Shenzhen Chuxin Electronic Equipment builds lead-free reflow ovens and full SMT lines aimed at exactly this segment of consumer, semiconductor, and military assembly. More levers do not fix a bad board design, but they make the job of finding the profile a lot less painful.
For the standards side of area-array work, GSFC-STD-6001A shows how tightly flight hardware specifies soldered interconnects, and MacDermid Alpha’s CVP-390V data sheet makes the case that “lead-free” alone is not a profile specification, since SAC305 and other lead-free alloys want different curves.
One more practical note on high-density lead-free work. Alloy choice changes the whole profile. AIM’s NC520 data sheet splits the recommendation into a short profile for low and medium thermal mass boards and a longer ramp, soak, spike profile for high-mass boards. Dense BGAs on heavy copper belong in the second group, not the first.
Next, in Section 6, we get into troubleshooting: what to do when the profile looks correct and the joints still look wrong.## 6. Reflow Profile Defects: Symptoms, Causes, and Corrective Actions
Most defect hunts start the wrong way. Someone spots a dull joint, decides the temperature was too low, and adds 10 °C to the peak zone. Sometimes that works. Often it creates a second problem while hiding the first.
The better approach is to treat symptoms as evidence, not conclusions. Temperature is one cause among many: printing, placement, paste condition, board design, moisture, atmosphere, and oven condition all write their own signature on the same board.
Troubleshooting by symptom
| Symptom | Profile clues | Non-profile causes to check | Confirmation method | Corrective action |
|—|—|—|—|—|
| Cold or incomplete joints, dull grainy surface | Peak below liquidus, TAL too short | Paste aged past floor life, poor printing volume, no-clean residue | Cut joint and view fillet; check paste print weight | Extend TAL, raise peak within component limits, refresh paste, verify stencil |
| Solder balls around pads | Ramp too fast, flux outgassing | Paste slump, excessive squeegee pressure, bad pad design | 3D or X-ray of pad field | Slow ramp, add soak time, check paste viscosity and stencil aperture |
| Tombstoning or skew | Fast cooling, short soak | Placement offset, one-side paste volume imbalance | 3D inspection of part height | Adjust cooling, extend soak, fix paste volume and placement |
| Bridging | Peak too high, TAL too long | Stencil aperture too large, pad-to-pad spacing tight, shift in print | Cross-section or 3D scan | Lower peak, shorten TAL, reduce aperture, check registration |
| Voiding inside BGA or QFN | Long soak, slow ramp | Entrapped gas, vented via-in-pad, heavy copper | X-ray inspection | Adjust ramp and soak, tent vias, evaluate vacuum-assisted reflow |
| Dewetting, pulled-back fillet | Peak too low or too short soak | Oxidized or contaminated pads, lead contamination | Cross-section of pad and joint | Restore proper peak and TAL, clean pads, verify alloy compatibility |
| Component discoloration or cracked package | Peak or soak too high for the part | Moisture in package, no bake, repeated reflow cycles | Compare body temp against data sheet, check MSL log | Lower peak, check bake and floor life, count reflow exposures |
| Delamination or blistering on the board | Long soak at high temperature | Moisture in laminate, poor via fill | Cross-section of the laminate | Keep soak inside paste TDS, dry boards before printing |
Pro Insight: Verify printing, placement, materials, and moisture controls before compensating with extra heat. Most “temperature problems” are actually paste or placement problems. Adding peak temperature to fix a printing defect cooks the assembly without ever touching the real cause.
A disciplined troubleshooting sequence
- Confirm paste condition. Check the tube or jar label date, the refrigerator log, and the paste’s viscosity and tack. Expired paste will not wet, no matter how hot the oven gets.
- Check print quality. Inspect deposits for volume, skew, and bridging before the board ever leaves the printer.
- Confirm placement accuracy. Look at offsets and rotation on the parts nearest the defects.
- Review moisture exposure. J-STD-020 classification plus your bake records tells you whether package cracking is a real possibility.
- Pull the measured profile. Zone setpoints alone prove nothing. Compare the thermocouple curve against the paste data sheet.
- Check oven condition. Fans, filters, heaters, and nitrogen flow all drift over time.
- Use inspection evidence. X-ray for hidden joints, AOI for surface defects. GSFC-STD-6001A shows how tightly mission-critical area-array interconnects get specified for this reason.
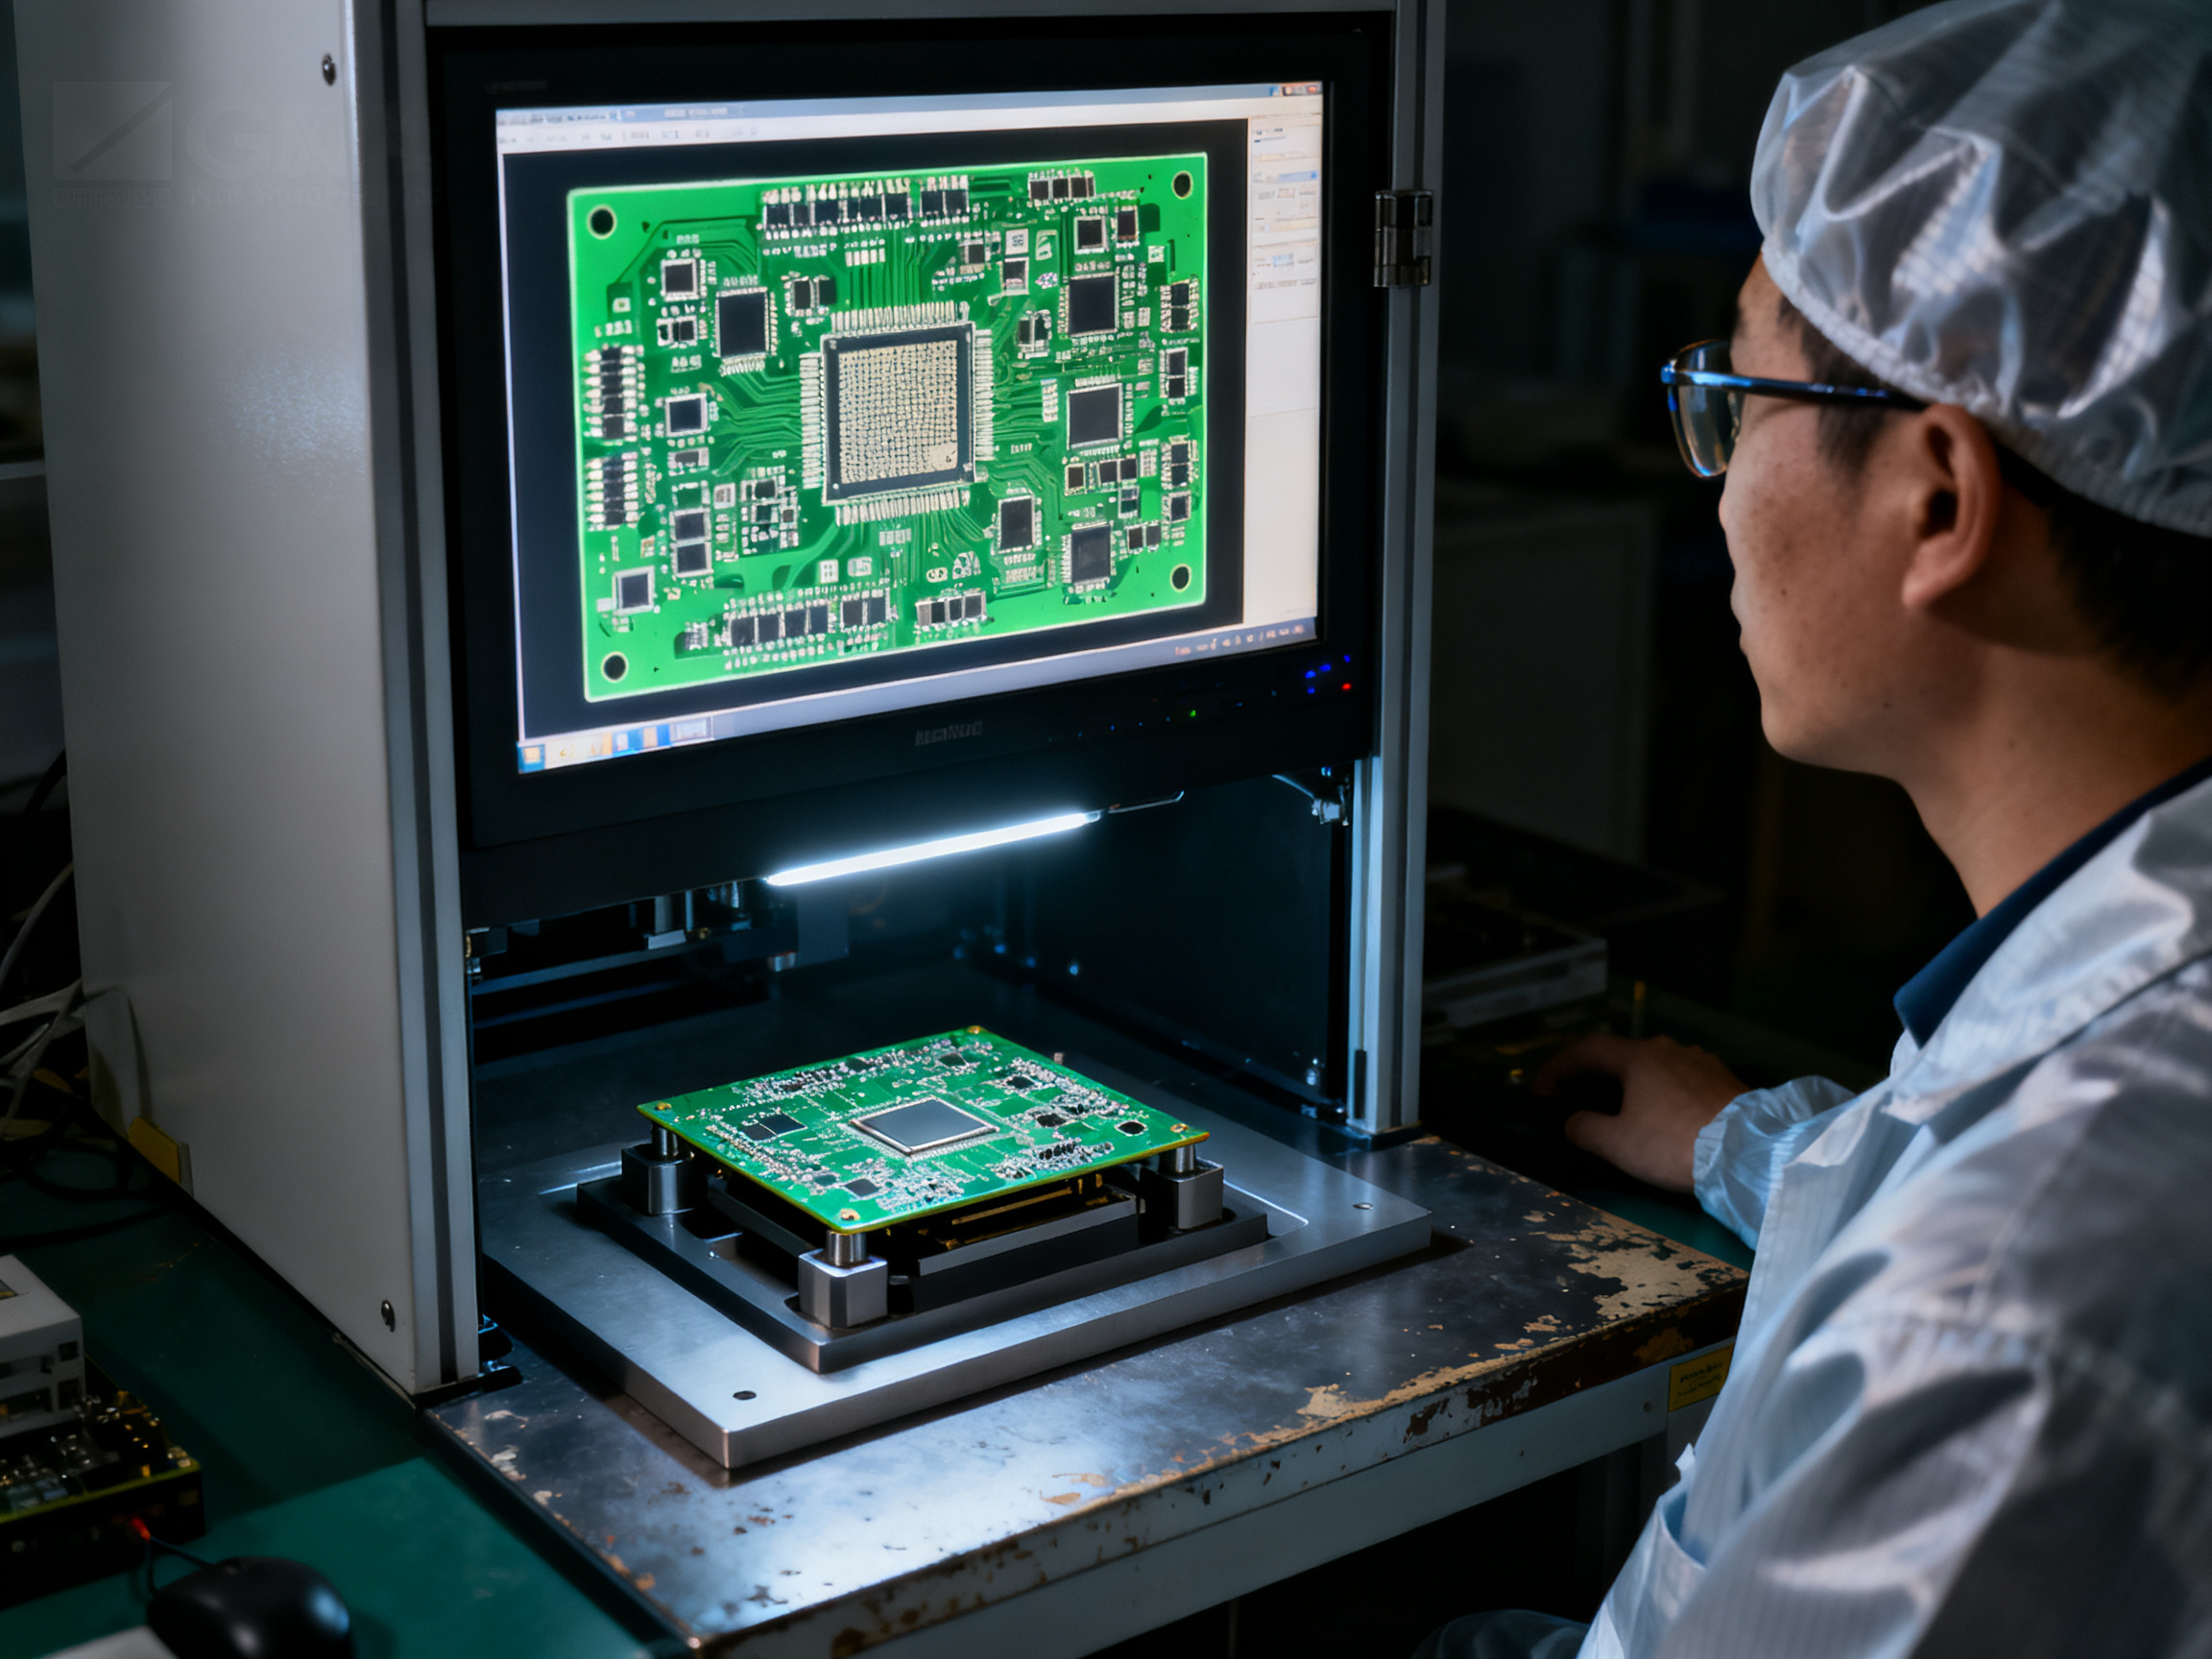
From Our Experience: The lesson we keep relearning is that a profile which is correct on paper can still produce bad joints because the profile was never measured at the failing location. One cold spot, one bad paste print, one moist component. We now walk the sequence in order and change one variable at a time, which is the same rule we used in profile development.
When you know which bucket the defect falls into, the fix becomes obvious, and sometimes the fix is not in the oven at all. It may be a better stencil, a drier component, or a different paste.
Looking at the equipment side, ovens with multi-zone ramp control, nitrogen capability, and recipe storage from Shenzhen Chuxin Electronic Equipment give you better control of the variables that matter, but the diagnostic habit is what actually saves you time.
Next, we pull the whole guide together in the conclusion.## Pro Insight #3: Do Not Fix Printing or Placement Problems With Heat
Pro Insight: Verify printing, placement, materials, and moisture controls before compensating with extra heat. Most “temperature problems” are actually paste or placement problems. Adding peak temperature to fix a printing defect cooks the assembly without ever touching the real cause.
Raising peak temperature or stretching time above liquidus can make a weak-wetting joint look better for a few minutes. It can also cook flux, embrittle intermetallics, and push components past their body temperature limit. Check solder volume and stencil transfer, part alignment, paste storage and floor life, and moisture exposure before you touch the oven recipe.
Attribution: [Insert verified author, reviewer, or company experience here, including the defect type, root cause found, and the measured result after correcting printing, placement, or moisture control.]## 7. Reflow Oven Selection, Process Control, and Production-Line Integration
The oven is the last piece of the reflow puzzle, and it is the piece that decides whether your profile holds at 2am on a Saturday when nobody is watching.
Zone count gets talked about most, but it is not the spec that matters. What matters is effective heating length, the number of degrees the board actually travels through the heated zone. An 8-zone oven with a short heated length gives you less control than a 4-zone oven with a long one. Look for the heated length in millimeters, not the zone number on the sales sheet.
Convection uniformity is the next one. Forced air with well-designed recirculation delivers the same profile to the front row of pallets and the back row. Poor airflow means your delta-T changes when you change the board load, and that is exactly where repeatability problems appear. Ask for delta-T data at the thermal mass of your real product, not on a bare laminate.
Then look at the cooling side. Cooling capacity, measured in degrees per second across the full conveyor width, decides whether you can hit a 4 °C per second ramp-down on a heavy BGA board or only on a light one. Board support matters too, because a board that flexes or has poor support in the cooling zone will warp, and warpage drives tombstoning and skewed joints.
Nitrogen capability, data logging, and recipe management finish the list. Nitrogen is product-specific and optional for many pastes; some paste suppliers specify an oxygen level at or below 1000 ppm, others are designed for air. Data logging is not optional in 2026. If the oven cannot store the profile and export it to your MES or quality system, traceability stops at the operator’s memory. GSFC-STD-6001A shows how tightly area-array interconnect control gets specified for mission hardware, and most commercial shops will never reach that level, but the documentation habit comes from the same place.
Buyer’s checklist for a new or replacement oven
- Effective heated length and number of independent zones
- Measured delta-T at realistic board load, both empty and full
- Cooling capacity in °C per second across full conveyor width
- Conveyor width, plus support rail and pallet system options
- Nitrogen option with oxygen-level control and logging
- Recipe storage capacity with user access control
- Profile and process data export (MES, CSV, or SPC-friendly format)
- Thermal mass ceiling and cycle time at production speed
- Oven uptime, spare parts lead time, and local service response
- Compliance support for lead-free work and your required standards
Weighted comparison framework
| Evaluation area | Weight | What good looks like | Legacy oven risk |
|—|—|—|—|
| Technical capability | 30% | Long heated length, strong cooling, measurable delta-T | Fixed zone setpoints, no profile export, weak cooling |
| Line integration | 20% | Fits conveyor, fixtures, and standard SMT protocols | Width mismatch, no SEC/SECS or MES link |
| Support and service | 20% | Local technician, spare parts, response time | Slow turnaround on heater or fan failures |
| Compliance | 10% | Lead-free capable, documentation for audit | No support for your required process records |
| Operating cost | 10% | Energy use, nitrogen consumption, consumables | Higher kWh per board, no recovery optimization |
| Scalability | 10% | Recipe library, multiple product families, growth headroom | Recipe limits, no user tiering |
Now, the honest question. Should you upgrade or replace? Run a simple test on the current oven: profile three consecutive runs at production speed with a full load. If peak moves more than 5 °C between runs, or if cooling falls below your paste limit under load, the problem is the hardware. No amount of recipe tuning fixes that. If repeatability is solid and the only complaint is that building profiles takes too long, then the fix is better tooling and zone granularity, not a new machine.
Ovens with multi-zone ramp control, nitrogen capability, and recipe storage give you more levers for exactly this kind of work, and Shenzhen Chuxin Electronic Equipment builds lead-free reflow ovens and full SMT lines aimed at high-density consumer, semiconductor, and military assembly. More levers do not fix a bad board design, but they shorten the distance between a symptom and an answer.
Next, we pull the whole guide together.## 8. Reflow Temperature Profile Checklist and FAQ
Before you sign off a recipe, run this list. It takes about ten minutes and catches most problems before they reach the line.
Pre-production checklist
| Check | What “good” looks like |
|—|—|
| Paste data sheet on file | Liquidus, soak band, ramp, TAL, peak, cooling limits all recorded |
| Component limits | Maximum body temperature and cycle count pulled from each data sheet |
| Thermocouple placement | Hot spot and cold spot chosen on a real populated board |
| Board load | Production quantity, pallet spacing, and board mix recorded |
| Oven condition | Fans, filters, heaters, and nitrogen flow verified before the run |
| Measurement locations | At least three joints, plus body temperature where a limit exists |
| Acceptance criteria | Ramp, soak, peak, TAL, cooling, delta-T, and repeatability limits written down |
| Recipe control | Profile stored in the oven, versioned, and exported to your quality system |
| Inspection plan | AOI for surface defects, X-ray for hidden BGA and QFN joints |
| Moisture records | Bake and floor-life logs tied to the component classification |
FAQ
What is reflow temperature? It is the temperature the solder joint must reach for the paste to melt and form a metallurgical bond. Sn63/Pb37 melts at 183 °C (361 °F). SAC305 melts around 217 to 221 °C (423 to 430 °F), and peak joint temperature usually runs 230 to 245 °C (446 to 473 °F).
What temperature does solder reflow at? It depends on the alloy, the paste, and the board. There is no universal number. Build from your paste data sheet, then verify by measurement.
What is the difference between melting point and peak temperature? Melting point is where the alloy becomes fully liquid. Peak temperature is the highest temperature your joint actually reaches, and it sits above melting point by design. Peak also has a duration limit, so the two values must be tracked separately.
How often should a profile be verified? At minimum, once per product introduction, then any time the process changes. Re-profile after switching solder paste or paste batch, a PCB revision, a change in component sourcing or package, oven maintenance or a heater repair, a change in conveyor speed, a shift in production loading or pallet configuration, or a meaningful change in ambient conditions.
Do I need to re-profile for a second-side assembly? Usually yes. The second pass sees the board already carrying heat, so the same recipe often produces a hotter first side than the second. Many lines run a separate second-side profile for exactly this reason.
Can I copy a profile from the paste vendor? Use it as your starting point. Vendor and qualification profiles, such as those published for classification testing, may not match your assembly at all. Validate on your own boards before you run production.
What about rework? Reflow cycles count against component limits. Track them, and use a lower peak when the data sheet allows it.
That last point is the one teams skip. A board that passes through the oven four times has seen four heat cycles, whether or not anyone logged the last one.
For more on profile development, defect troubleshooting, and equipment selection, the earlier sections of this guide cover the measurement method, the four profile stages, and the process windows for lead-free and tin-lead work.## Conclusion: Establish a Repeatable Thermal Process Window
A working reflow process is not defined by a single oven setpoint. It is defined by measured assembly temperatures sitting inside a validated window, on the part that is hardest to heat, every time the line runs.
The order of operations matters. Start from your solder paste data sheet and your component limits. Profile the hot joint and the cold joint on a real populated board. Confirm the result in X-ray or AOI, not by eye alone. Then control recipe changes with one variable at a time and a log.
From Our Experience: The most useful thing we can tell you is that a profile nobody measured is just a guess with good documentation. Audit what you have before you change it.
| Step | Action | Why it matters |
|—|—|—|
| 1 | Audit your current profile: zone setpoints, conveyor speed, measured peak, TAL, delta-T, repeatability across three runs | Shows you what you actually have, not what the recipe claims |
| 2 | Identify your highest-risk assembly (largest BGA, smallest part on an isolated island) and run a documented baseline with thermocouples | Fixes a real number before any equipment or setting changes |
| 3 | Lock the recipe: acceptance limits, one change at a time, profile stored and exported | Makes the process repeatable across shifts and operators |
Before you go further, pull the primary documents that set your limits: IPC/JEDEC J-STD-020 for package classification and GSFC-STD-6001A for how tightly area-array interconnects get specified. If your line needs better profiling resolution, zone control, or recipe logging, lead-free reflow ovens and full SMT lines from Shenzhen Chuxin Electronic Equipment are built for high-density consumer, semiconductor, and military work.
Attribution: [Insert verified author or reviewer perspective here: assembly type profiled, thermocouple locations, delta-T observed, and the measured outcome from the audit and baseline run.]## From source log to a controlled reflow profile
A reflow profile is not a universal temperature curve. It is a process recipe that must satisfy the solder alloy, the component package, the board construction, and the thermal mass of the assembled product. The sources collected for this guide support a controlled decision sequence rather than a single set of numbers.
1. Establish the component and handling constraints first
Start with the component classification and handling requirements. IPC/JEDEC J-STD-020, Revision F, provides the moisture sensitivity and reflow classification framework for plastic surface-mount packages. J-STD-033, Revision D, covers handling, packing, floor-life, bake, and exposure controls for MSL-classified parts. Non-IC components such as resistors, capacitors, and connectors should be checked against ECA/IPC/JEDEC J-STD-075, Revision 0.
These documents are classification and control standards, not board-assembly recipes. A package classification can establish a temperature and exposure constraint, but it does not determine the complete ramp, soak, peak, or cooling curve for a finished board.
Where a manufacturer publishes a qualification or preconditioning profile, treat it as an input rather than as a production profile. Qorvo explicitly states that its published solder-reflow profiles are intended for classification and preconditioning and may not match a board-assembly process. The package body-temperature limit remains governing: when a component ceiling is lower than the solder-paste peak recommendation, the component limit wins.
2. Select the paste-specific thermal window
The alloy and paste determine the relevant liquidus, soak, time-above-liquidus, peak, and cooling guidance. For the SAC305 paste represented by ALPHA CVP-390, the technical data sheet specifies a liquidus range of 217 to 221 °C, a soak range of 155 to 175 °C for 60 to 100 seconds, and a time-above-liquidus range of 45 to 90 seconds. The sheet lists ramp rates of 0.7 or 1.3 °C per second and cooling rates of 1 to 6 °C per second. Its 250 °C withstand statement is not a recommendation to use a 250 °C peak.
These values must be read with the paste document’s actual process context. The CVP-390 figures apply to convection reflow. ALPHA’s CVP-390V data sheet demonstrates why ‘lead-free’ is not sufficient profile terminology: a different paste can require different profile recommendations even when the alloy family is similar.
For low- and medium-thermal-mass boards, AIM’s NC520 data sheet describes a shorter profile, while high-mass boards may need a longer ramp, soak, and spike profile. The retrieved source did not expose the exact ramp, time-above-liquidus, and peak values, so those values remain unfilled rather than being inferred from another paste or from the SAC305 example.
Do not transfer a vapor-phase profile into a convection profile. AIM’s WS483 data sheet lists a vapor-phase peak range of 230 to 245 °C, a ramp to 150 °C, progression through 150 to 175 °C, a maximum cooldown of 4 °C per second, and a maximum rise of 2 °C per second. Those values apply to vapor-phase oven processing and are not a general reflow recipe.
3. Match the profile to board thermal mass
A useful production profile has several observable stages rather than only a peak-temperature setting:
- Ramp: heat the assembly at a controlled rate while reducing thermal shock and allowing the board and components to respond together.
- Soak: hold the assembly in the paste’s specified soak region so flux activity and solder-paste behavior can develop consistently.
- Time above liquidus: measure the interval in which the solder is above its liquidus, not merely the duration of the oven cycle.
- Peak: reach the paste-compatible peak while remaining below every applicable package body-temperature limit.
- Cooling: remove heat at a controlled rate while avoiding package or board stress and while producing acceptable joint formation.
For SAC305, the working example from the CVP-390 data sheet is therefore a controlled process envelope, not a universal setpoint: liquidus 217 to 221 °C, soak 155 to 175 °C for 60 to 100 seconds, time above liquidus 45 to 90 seconds, ramp rate 0.7 or 1.3 °C per second, and cooling 1 to 6 °C per second. Confirm the final recipe against the exact paste, board, package limits, and oven capability.
The board’s thermal mass changes the profile because the measured workpiece temperature lags the oven setpoints. A dense BGA or QFN board may require more gradual heating and a longer soak than a small, low-mass assembly. The supplier’s profile family should be selected by assembly type, then verified with thermocouples.
4. Measure the product, not just the oven
The ECD profiling material describes the use of stage definitions and multiple thermocouples. In practice, the measurement plan should identify the relevant hot and cold locations: the package or component being protected, the solder-joint region or board area with the slowest response, and any large thermal feature that can create a local temperature spread.
Attach thermocouples securely and record the complete trace from ramp through cooling. A profile report should show, at minimum, the measured ramp rate, soak time and temperature, time above liquidus, peak temperature, and cooling rate. Compare those measured values with the paste data sheet and the component limits. Do not accept an oven recipe that looks correct on its display while the board does not follow it.
5. Treat atmosphere, cooling, and conveyor performance as product capabilities
Nitrogen requirements are product-specific. A nitrogen atmosphere may be required or recommended for a particular assembly, but the source log does not support a blanket nitrogen requirement for every board. Record the actual atmosphere used and verify the supplier’s conditions.
Vacuum-assisted reflow should be justified by measured void data and the defect mode under investigation. It is not automatically superior for every assembly. Likewise, evaluate cooling capacity in degrees per second across the full conveyor width. The number of oven zones does not establish the workpiece’s achieved cooling rate.
For wave soldering, NASA-STD-8739.2 lists preheat, conveyor-speed, wave-height, and solder-pot guidance, including a 249 to 274 °C solder-temperature range. Those are wave-pot values within the NASA workmanship scope; they must not be copied into a reflow peak-temperature table.
6. Use a troubleshooting sequence that preserves evidence
When a joint or package defect appears, preserve the profile trace before changing multiple variables at once. A practical sequence is:
- Confirm paste, alloy, stencil, deposit, and component-lot information.
- Verify package classification, bake history, floor life, and moisture exposure.
- Check the measured profile against the paste’s process window and every package body-temperature limit.
- Inspect oven atmosphere, ventilation, conveyor loading, and cooling performance.
- Review the joint or package defect for evidence of insufficient heating, excessive heating, inadequate wetting, voiding, thermal mismatch, or handling damage.
- Change one controlled variable when possible, repeat the profile, and compare before-and-after traces.
Change control should record the oven recipe, paste lot and revision, board revision, component revision, thermocouple locations, atmosphere, conveyor speed, defect sample, and measured profile. A before-and-after comparison is more useful than an anecdotal statement that a new setting ‘fixed’ an assembly.
What can be published now
The SAC305 convection profile example is supported by a named paste data sheet and can be published with the stated conditions and caveats. The handling and classification framework is supported by IPC/JEDEC standards. The wave-soldering and vapor-phase numbers are valid only within their named process contexts. Qorvo’s qualification-versus-production distinction should remain visible because it prevents a qualification curve from being mistaken for a board recipe.
Two profile rows should remain explicitly unfilled until primary documents are obtained: the Sn63/Pb37 production values for peak, time above liquidus, soak, and cooling; and the low-temperature bismuth paste values. The 183 °C liquidus point for Sn63/Pb37 is not enough to publish a complete production profile, and generic SAC305 settings may overheat a bismuth assembly. The author and technical-reviewer credentials also require confirmation before the metadata block is finalized.
The result is a profile program with an evidence trail: classify the parts, select the exact paste data sheet, choose a profile family by board thermal mass, measure the actual workpiece, enforce the strictest package limit, and document every controlled change.## Keyword Placement Map
This map shows where each search phrase lives in the guide, so every target term appears where a reader would naturally look for it. Nothing here is stuffed. Each phrase sits next to the answer it belongs to.
| Target phrase | Placement | Search intent served |
|—|—|—|
| reflow temperature | Title, introduction, Section 3, FAQ answer, conclusion, meta title, meta description | General definition and range lookup |
| reflow temperature profile, reflow profile, what is reflow profile | Introduction, Section 2 header and body, annotated chart caption, FAQ | Wants the curve explained, stage by stage |
| reflow soldering temperature, solder reflow temperature, reflow solder temperature | Sections 1 and 3, FAQ | Wants the process temperature in plain terms |
| what is reflow soldering, reflow soldering meaning, what is reflow soldering in PCB | Section 1 opening and process table | Novice definition question |
| how does reflow soldering work, how reflow soldering works | Section 1 step sequence and flow diagram | Wants the line sequence explained |
| what is reflow soldering used for | Section 1 comparison table | Wants use cases and process limits |
| what temperature does solder reflow, temperature to reflow solder | Section 3, FAQ | Alloy dependent range question |
| lead-free reflow temperature | Sections 3, 5, and conclusion | Lead-free specific window and limits |
| temp to reflow solder, solder reflow temperature fahrenheit | Section 3 conversion list | Unit conversion need |
| thermal profiling, peak reflow temperature, time above liquidus, reflow oven zones, SAC305, BGA, QFN, solder paste, wetting, process window | Sections 1 through 7 body text | Supports the technical terms behind each search |
Meta title: Reflow Temperature Guide: Profiles, Ranges, and Lead-Free Limits
Meta description: Learn what reflow temperature means, which peak and time above liquidus values to use for SAC305 or tin-lead, and how to build a validated reflow temperature profile.
Placement rules we followed: the primary phrase carries the headline and the range section, concept phrases carry the profile explanation, and long-tail questions get answered in the order a reader asks them. Semantic terms such as thermal profiling and peak reflow temperature appear where they belong in the technical body, not in the metadata.
Editor note: Keep one primary phrase per heading. Repeated headings that chase multiple keyword variants read like spam, and search engines now penalize that pattern harder than they reward it.## Supporting Media and Trust Elements
Good technical content deserves more than a wall of text. Every number in this guide sits next to a visual, a decision tool, or a citation, so a reader can check the work rather than take it on faith.
Where each asset goes
| Asset | Placement | What it helps the reader do |
|—|—|—|
| Annotated reflow curve | Right after the introduction | See ramp, soak, peak, and cooling as one continuous story instead of four disconnected temperatures |
| SMT process flow diagram | Section 1, under the seven step sequence | Follow the board from stencil to inspection and know where the oven fits |
| Thermocouple placement diagram | Section 2 and Section 4 | Put a probe on the hottest and coldest joints rather than somewhere convenient |
| Alloy temperature comparison table | Section 3 | Pick the right alloy window before touching the recipe |
| Profile adjustment decision tree | Section 4 | Diagnose a bad curve and pick one variable to change |
| Defect troubleshooting matrix | Section 6 | Match a visible defect to profile and non-profile causes |
| Oven selection scorecard | Section 7 | Compare quoted machines on the same criteria instead of on zone count |
| Printable profile checklist | Section 8 | Print it, run it on the line, sign it off |
| Process glossary | End of Section 8 | Look up TAL, liquidus, delta-T, MSL, and head-in-pillow without leaving the page |
How the visuals get their numbers
Every chart in this guide was built from published primary sources, and the source sits beside the figure, not in a footnote nobody reaches.
- The SAC305 curve uses the MacDermid Alpha CVP-390 data sheet for liquidus, soak band, time above liquidus, ramp, and cooling.
- The wave soldering figures come from NASA-STD-8739.2, and they are labeled as wave pot values so nobody pastes them into a reflow peak column.
- Package and moisture limits trace to IPC/JEDEC J-STD-020, which is a classification standard, not a board recipe.
Table revision dates were checked when this guide was assembled in October 2026. Where a document revision could not be confirmed, the row stays marked as unverified rather than filled with a plausible number.
Disclosure and methodology notes
A few plain statements so readers know how this material was put together.
- Typical ranges are not specifications. Values in this guide are starting points for profile development. Your solder paste data sheet and your component data sheets are controlling.
- Two rows are intentionally left open. The Sn63/Pb37 production window and low-temperature bismuth values were not supported by a current official paste data sheet, so they are marked unverified instead of being copied from SAC305 figures.
- Qualification profiles are not production profiles. Manufacturer application notes for classification testing are flagged where they appear, following Qorvo’s own caution on the point.
- Commercial disclosure. Reflow oven and SMT line equipment from Shenzhen Chuxin Electronic Equipment is referenced as an example of multi-zone, nitrogen-capable, recipe-storing ovens. Those mentions are editorial examples, not product endorsements, and no vendor paid for this guide.
- Author and reviewer credentials are unverified. The byline and technical reviewer fields stay as placeholders until the names, titles, and hands-on experience are confirmed in writing.
- No board was harmed for this article. Every figure comes from published data or from illustrative measurement structure, not from a production line used as a test fixture.
Image credits and alt text
Custom diagrams here are original work created for this guide, so reuse them freely in your own internal training material. Alt text follows the same discipline as the captions: the annotated curve reads “Reflow profile curve showing ramp to soak at 155 to 175 degrees Celsius, peak at 230 to 245 degrees Celsius, and cooling at 1 to 6 degrees Celsius per second,” and the thermocouple diagram reads “Board cross-section with thermocouples attached to a large ground plane, a mid-size joint, and a small component on an isolated island.”
If you want the printable checklist as a standalone sheet for the line, the Section 8 table is formatted to be copied directly into your quality system or posted at the oven station.