
1. The Physics Behind the Solder Wave
A wave soldering machine does not heat a board with one temperature. It exposes the board to a moving surface of molten solder, then transports heat into the copper lands and component leads through conduction. The quality of the resulting joint depends on the entire thermal history: the temperature of the solder pot, the energy transferred through the wave, the preheat available to the assembly, the time the board spends in contact with the wave, and the rate at which the assembly cools afterward.
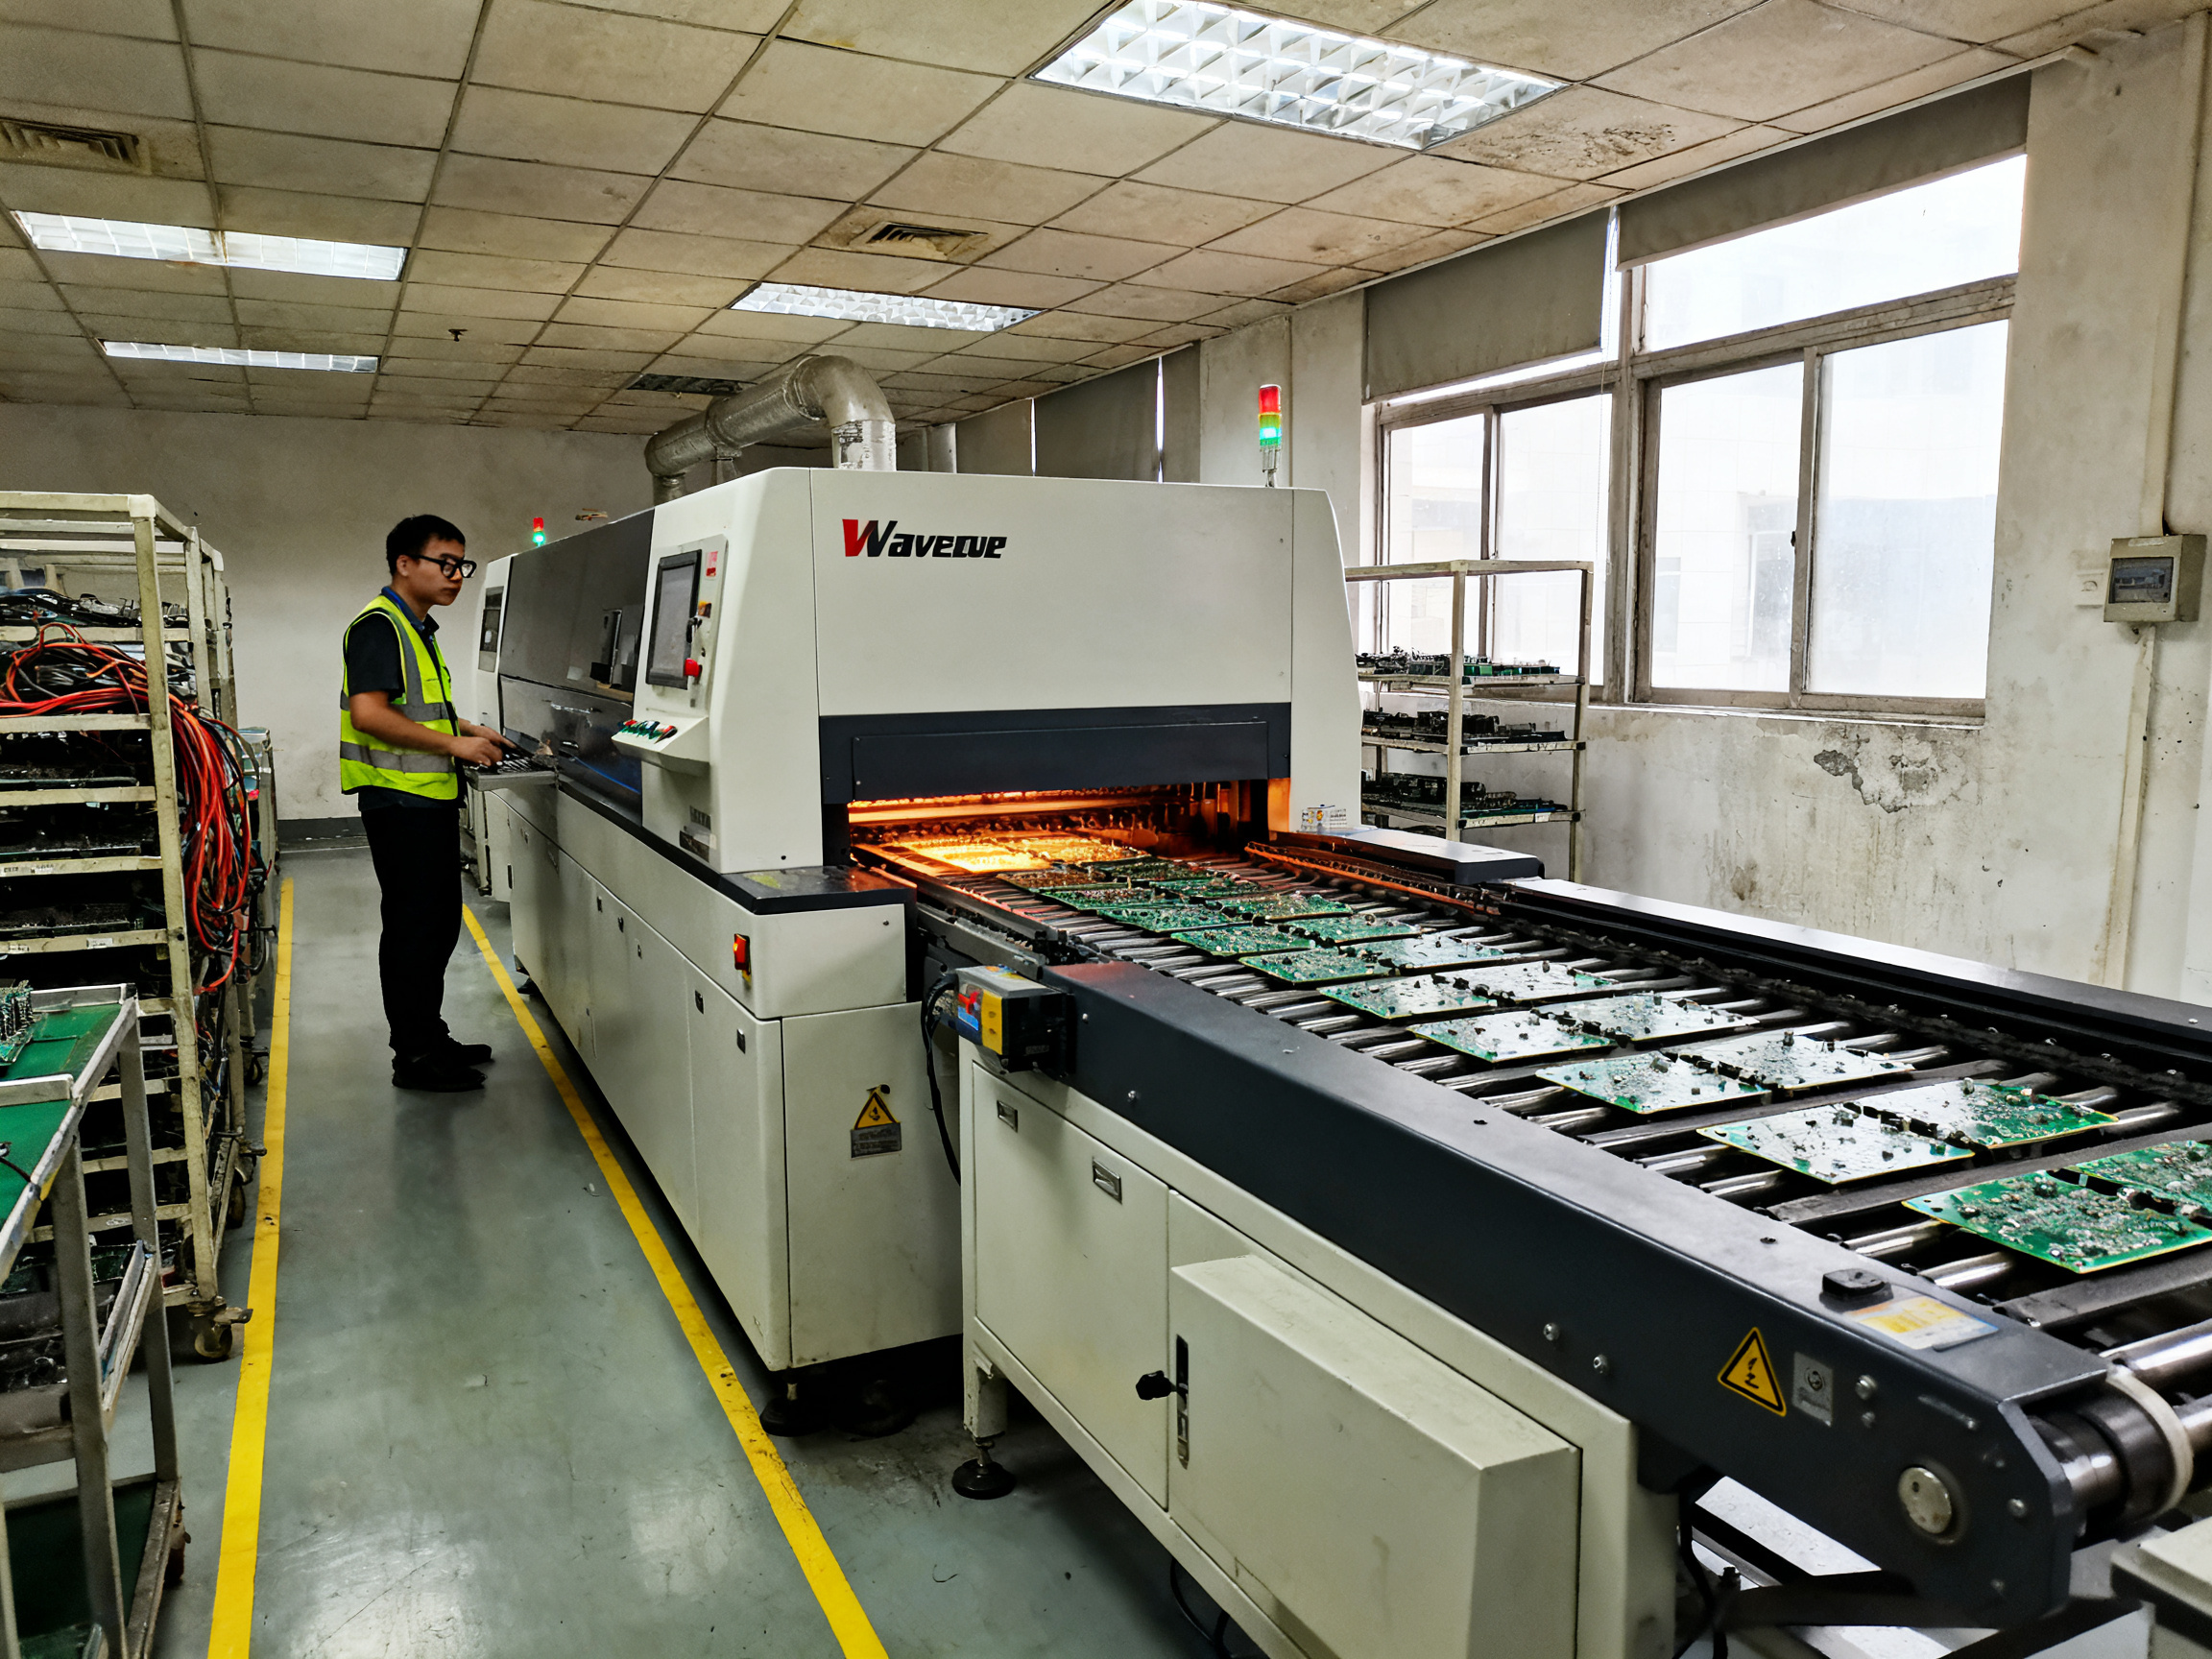
The displayed pot temperature is therefore only one part of the process. It may be a useful control variable, but it is not a direct measurement of the joint temperature. A pot can read 255°C while the solder at the wave surface is cooler, disturbed, or chemically contaminated. Conversely, a properly controlled wave can produce excellent joints even when the HMI value appears slightly different from the nominal recipe, provided the measured profile remains within the validated limits.
What actually happens when a board enters the wave
The board first passes through the preheat and fluxing zones. The preheat raises the temperature of the component bodies and PCB, reducing the temperature difference between the board and the molten solder. This matters because excessive thermal shock can crack ceramic components or delaminate multilayer boards. It also helps activate and dry the flux before the board reaches the wave.
At the wave, the solder transfers heat to the pads and leads. If the assembly is too cold, the solder may cool and solidify before it has adequately wetted the joint. If the assembly is too hot, the flux can burn off prematurely, excess oxidation can occur, and the component or board may exceed its process limit.
The ideal condition is a controlled wetting interval in which the solder remains molten around the joint long enough to form a reliable intermetallic structure and a smooth, continuous fillet. After the wave, the board travels through controlled cooling. Too-slow cooling can increase the formation of undesirable phases or produce larger grain structures; too-fast cooling can create thermal stress. In most lead-free processes, the objective is not simply to cool quickly, but to cool consistently while keeping the entire assembly within its material and component limits.
Why the pot temperature alone cannot explain the result
Several variables can change the effective joint temperature without changing the HMI setpoint:
- Solder-pot condition: Dross, oxide, sludge, or depleted solder changes the effective heat transfer and can increase the apparent temperature needed to maintain a usable wave.
- Wave height and stability: A low, uneven, or turbulent wave changes the contact area and the amount of heat delivered to each board.
- Conveyor speed: Changing speed changes the dwell time in the wave and therefore the total heat input.
- Preheat temperature: A warmer board requires less additional energy at the wave, while a cold board absorbs more heat.
- Board loading and thermal mass: Dense assemblies with large copper areas heat and cool differently from small, light boards.
- Nozzle and pump performance: Flow instability can produce local hot spots and cold spots across the wave.
- Ambient conditions and line configuration: Drafts, nearby heat sources, and poorly insulated machines can influence repeatable results.
This is why experienced process engineers treat temperature as a profile rather than as a single number. The profile may be measured at the wave, at the board surface, or at a representative joint. The correct measurement location depends on what you are trying to control. A pot thermocouple is useful for machine protection and process monitoring; it is not a substitute for a product-level thermal profile.
2. How Wave Soldering Temperature Is Measured
There are several practical ways to measure temperature in a wave soldering process. No single method answers every question, so production lines commonly use more than one.
Thermocouples
A thermocouple is usually the most direct method for measuring the temperature of the molten solder or a board during a process trial. It consists of two dissimilar metals joined at a measuring junction. The voltage generated at that junction changes predictably with temperature.
For a robust profile, engineers commonly use a thin-wire thermocouple attached to the surface of a representative test board. The sensor should be positioned near the joint or thermal zone of interest, secured without changing the normal board geometry, and connected through appropriate signal conditioning. The profile is then recorded while the board passes through the machine at production speed.
Thermocouple measurements are valuable because they show actual product temperatures over time, including soak, ramp, wave contact, and cooling. However, the sensor itself can disturb local heat transfer, especially if it is large or poorly attached. A measurement that is accurate in air may not represent the same location in a dense assembly. Measurement location, attachment method, sensor type, and data logging rate should therefore be documented.
Infrared thermography
An infrared camera measures surface radiance and converts it into an apparent temperature. This method is excellent for observing the uniformity of a wave, identifying hot and cold regions, checking board preheat, and investigating conveyor or nozzle problems. It can also provide a spatial map that is difficult to obtain with a few thermocouples.
Infrared measurements have important limitations. Emissivity changes dramatically when a shiny metal board or molten solder surface is viewed by the camera. Reflections from the machine, glowing elements, and nearby components can also distort the result. For reliable comparisons, the camera view angle, emissivity setting, focus, wavelength, and reference material should be controlled. An infrared image should generally be used as a diagnostic tool alongside a calibrated contact measurement, not as an unquestioned absolute temperature.
Fixed process monitors
Many machines include thermocouples in the solder pot, preheat zones, and wave area. These are useful for machine-level control and for detecting drift. They help answer questions such as whether the pot heater is maintaining its setpoint and whether a preheat zone is operating consistently.
The distinction between a machine monitor and a product profile is crucial. A fixed pot thermocouple tells you about the machine’s internal sensor location. It does not necessarily tell you the temperature experienced by a particular lead or pad. For process qualification, collect a profile on a representative production board and use the machine monitors to confirm that the equipment continues to reproduce that profile.
Solder temperature and joint temperature are not interchangeable
The temperature of the molten solder in the pot, the temperature of the wave contacting the board, and the temperature at a specific joint are different quantities. The difference can be substantial when the wave is disturbed, the board has low thermal mass, or the contact time is short. Always state what the measurement represents.
A good measurement record should identify:
- The measured location and component or board side
- The sensor or instrument used
- The board construction and assembly loading
- The machine recipe and conveyor speed
- The ambient conditions, if relevant
- The sampling or logging frequency
- The profile acceptance limits
- The result for each run
3. How Wave Soldering Temperature Is Calculated and Determined
There is no universal calculation that converts a HMI setpoint into a guaranteed joint temperature. The appropriate calculation is a validated, profile-based procedure. The following framework is commonly used for lead-free wave soldering.
Step 1: Define the product and process limits
Begin with the requirements of the assembly rather than with a generic temperature number. Review the PCB thermal limits, component temperature ratings, solder alloy specification, flux behavior, pad geometry, copper thickness, board thickness, and the required inspection criteria.
For lead-free alloys, the alloy’s melting range and practical wave temperature must be considered together with the supplier’s recommendations. A nominal temperature is not a substitute for a safe operating range. The profile should provide enough margin above the alloy’s working range for normal control variation while remaining below the limits of the flux, board, and components.
Step 2: Establish the line operating points
For each product family, record the settings used in the following areas:
- Preheat-zone temperatures and ramp rates
- Flux application or foaming conditions
- Solder-pot temperature
- Wave height and wave-contact conditions
- Conveyor speed and wave dwell time
- Cooling-zone conditions
- Reflow or exit conditions
The operating points must be treated as a recipe. If one setting changes, the other settings should be reviewed rather than adjusting only the pot temperature and assuming the board profile is unchanged.
Step 3: Measure the profile
Run a representative board through the machine using a calibrated or verified measurement system. Record the time-temperature curve through the relevant zones. For wave soldering, pay particular attention to the preheat plateau, the temperature at wave contact, the time above the alloy’s liquidus during wave exposure, and the cooling behavior after the wave.
The profile should be evaluated against the product specification. Typical criteria may include:
- The preheat temperature is sufficient to reduce thermal shock and support flux activation.
- The board does not exceed the maximum allowable component or PCB temperature.
- The wave contact produces a continuous, fully wetted joint.
- The time above the liquidus is sufficient for joint formation without excessive heating.
- The ramp and cooling rates remain within the validated limits.
- Results are repeatable from board to board and run to run.
Step 4: Calculate the process window
The process window is the range in which the assembly can be produced while meeting all requirements. It is normally determined by making controlled changes to the most influential variables and measuring the result.
For example, if cold joints appear when the conveyor speed increases, reduce the wave dwell effect by adjusting the thermal recipe in a controlled sequence. Measure the joint profile and inspect the resulting joints after each change. A larger thermal input, a higher preheat temperature, or a longer wave contact may restore wetting, but each change can introduce another risk if used by itself.
Do not calculate a new setpoint from the pot reading alone. Instead, use the measured relationship between recipe changes, product profile, and joint outcomes. In a stable process, small measurement variation is acceptable only when the profile remains inside the qualified window.
Step 5: Correlate the profile with inspection results
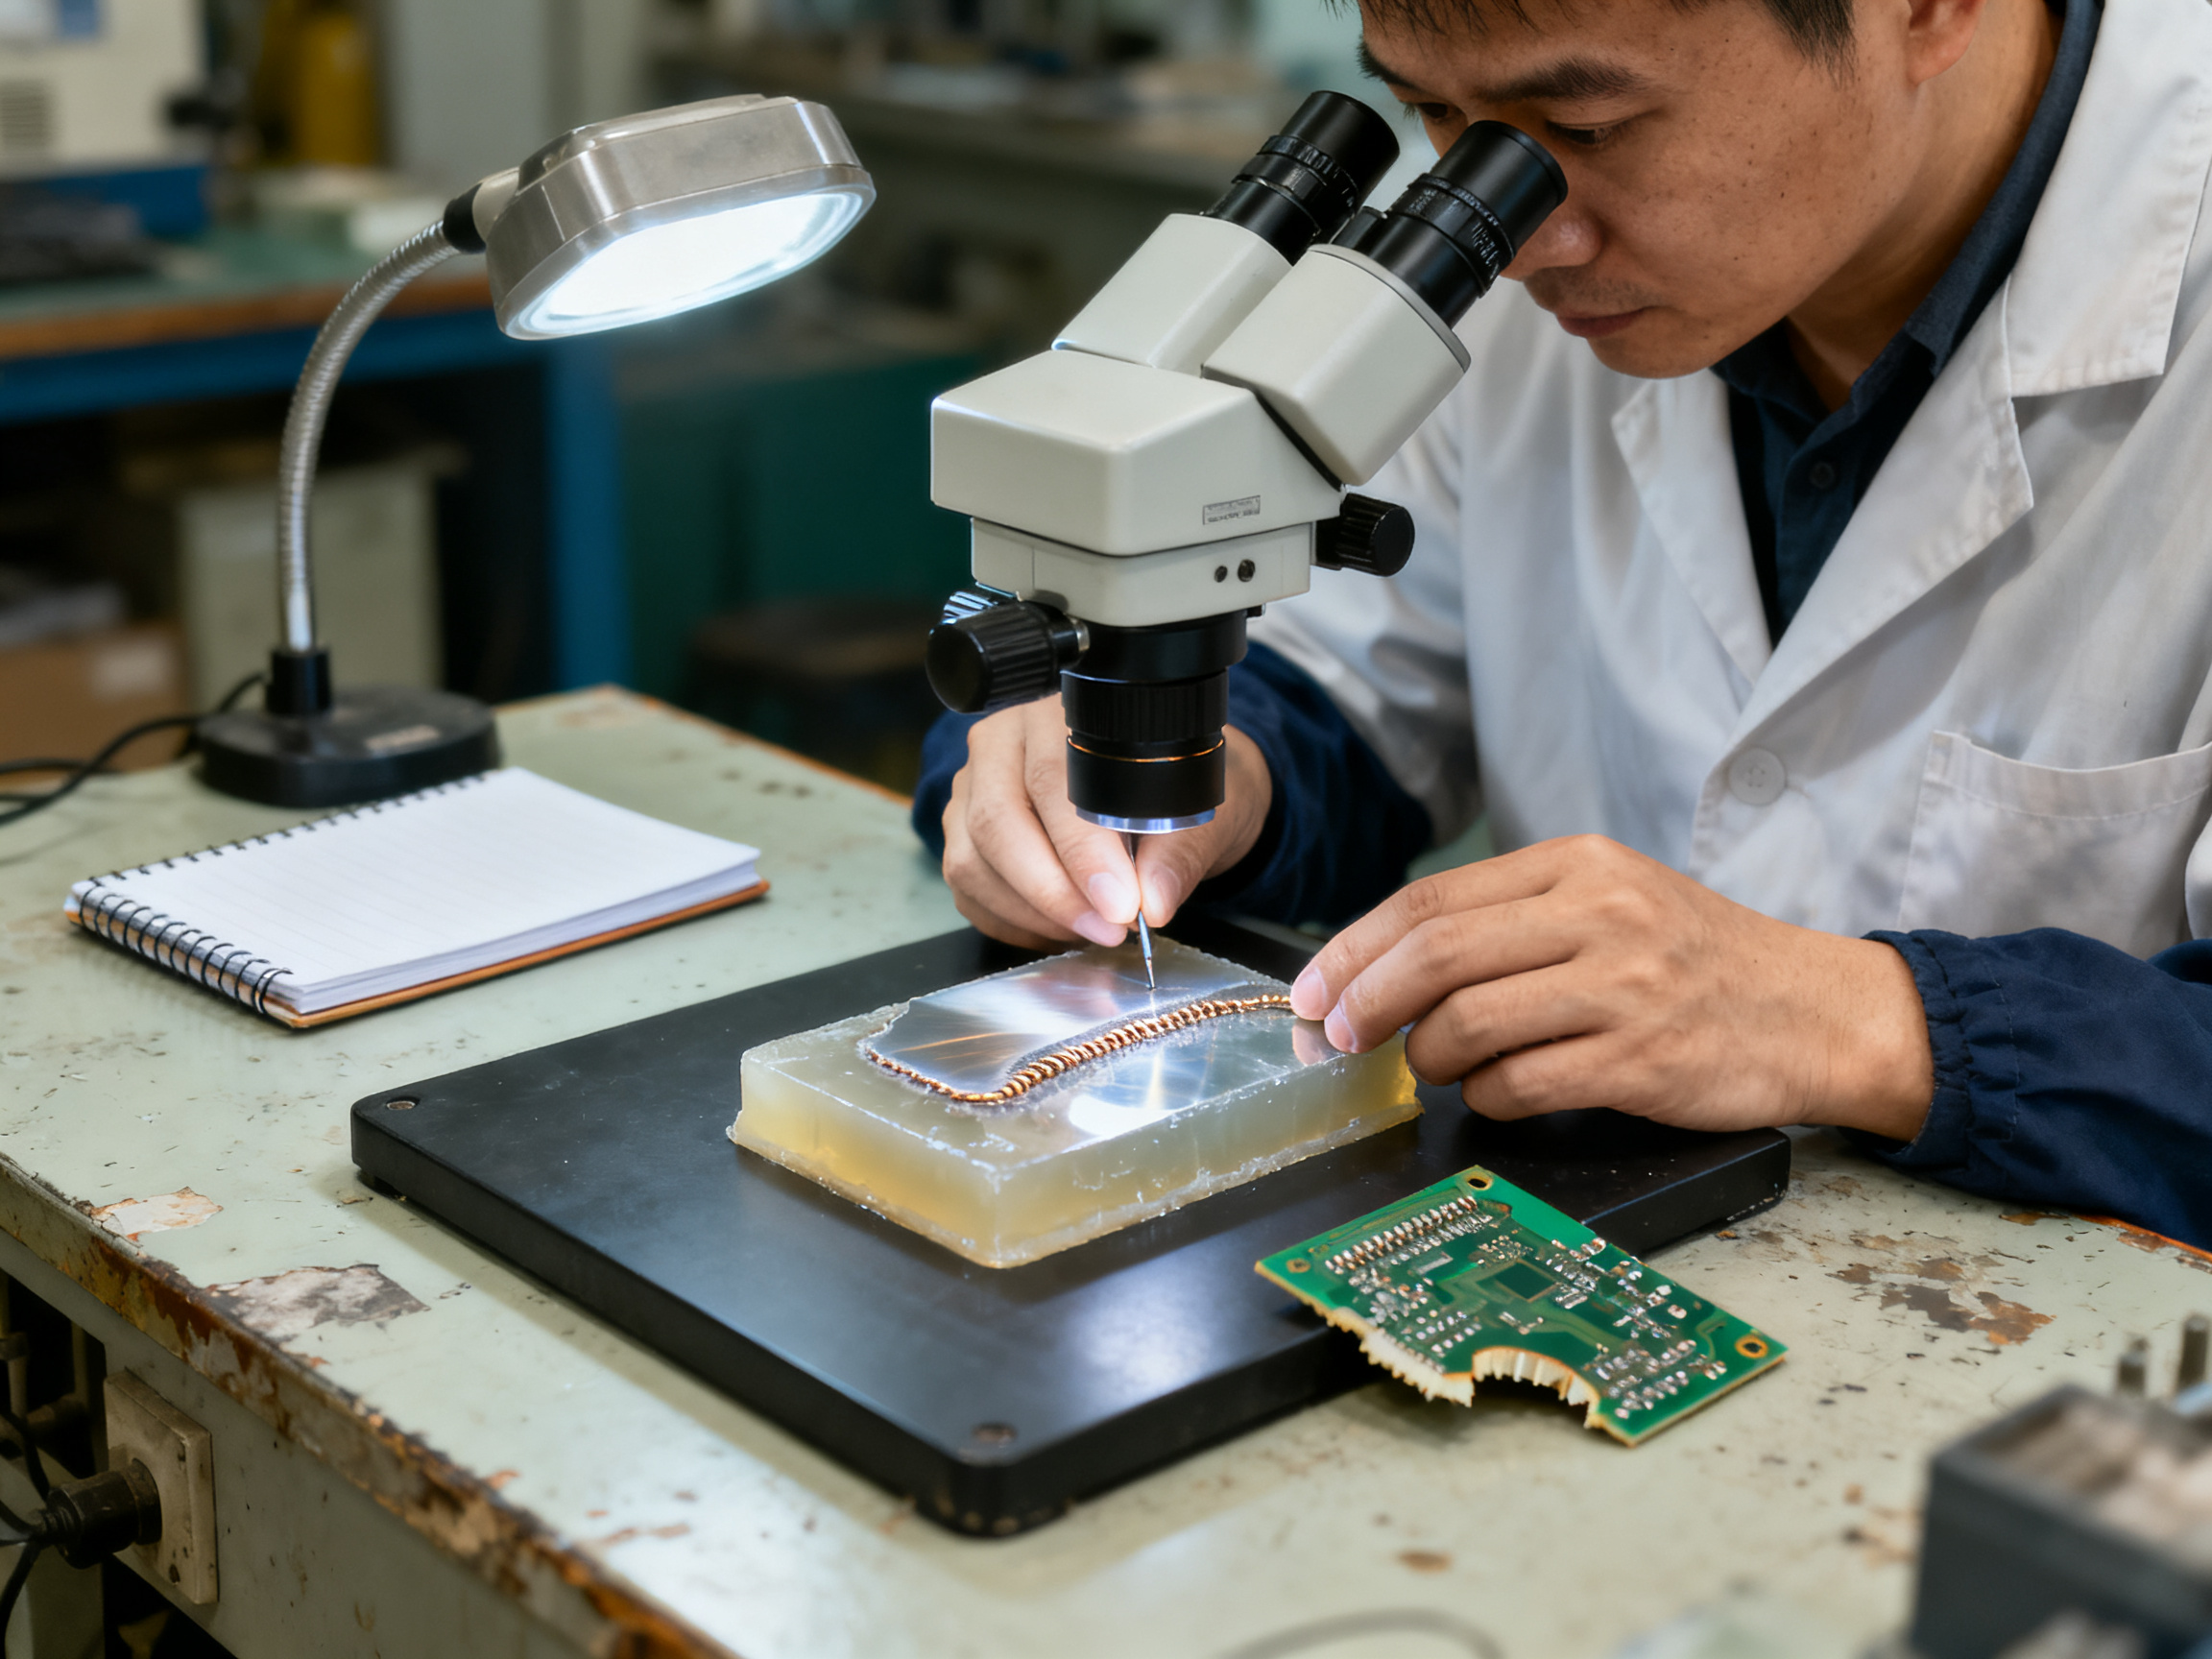
Temperature is meaningful only when it produces the required physical result. Cross-section or microsection selected joints, examine wetting, inspect for bridging, voids, insufficient fill, cold joints, and excessive intermetallic growth, and compare the results with the recorded profile. The inspection data closes the loop between the thermal measurement and actual quality.
4. A Practical Temperature-Control Strategy
The best control strategy is preventive. It keeps the process inside its qualified window instead of waiting for defects to appear.
Control the important variables
Use a machine recipe that locks or tightly controls the pot temperature, preheat zones, wave height, conveyor speed, and cooling conditions. Where possible, enable recipe permissions, change logging, and deviation alarms. Operators should be able to see which settings are active and should not be allowed to compensate for a drifting process with undocumented adjustments.
Monitor the machine continuously
Track the solder-pot temperature, preheat-zone temperatures, wave height, conveyor speed, and relevant alarms. Trend the data over time. A stable average can conceal a moving average, and a single reading can conceal a short disturbance. Look for slow drift, periodic variation, and correlations with maintenance events or changes in production mix.
Check the solder pot and wave condition
Inspect the pot for dross, oxide, sludge, contamination, and excessive skimming. Check the wave for holes, turbulence, instability, and uneven height. These conditions can change the process even when the pot thermocouple remains on target.
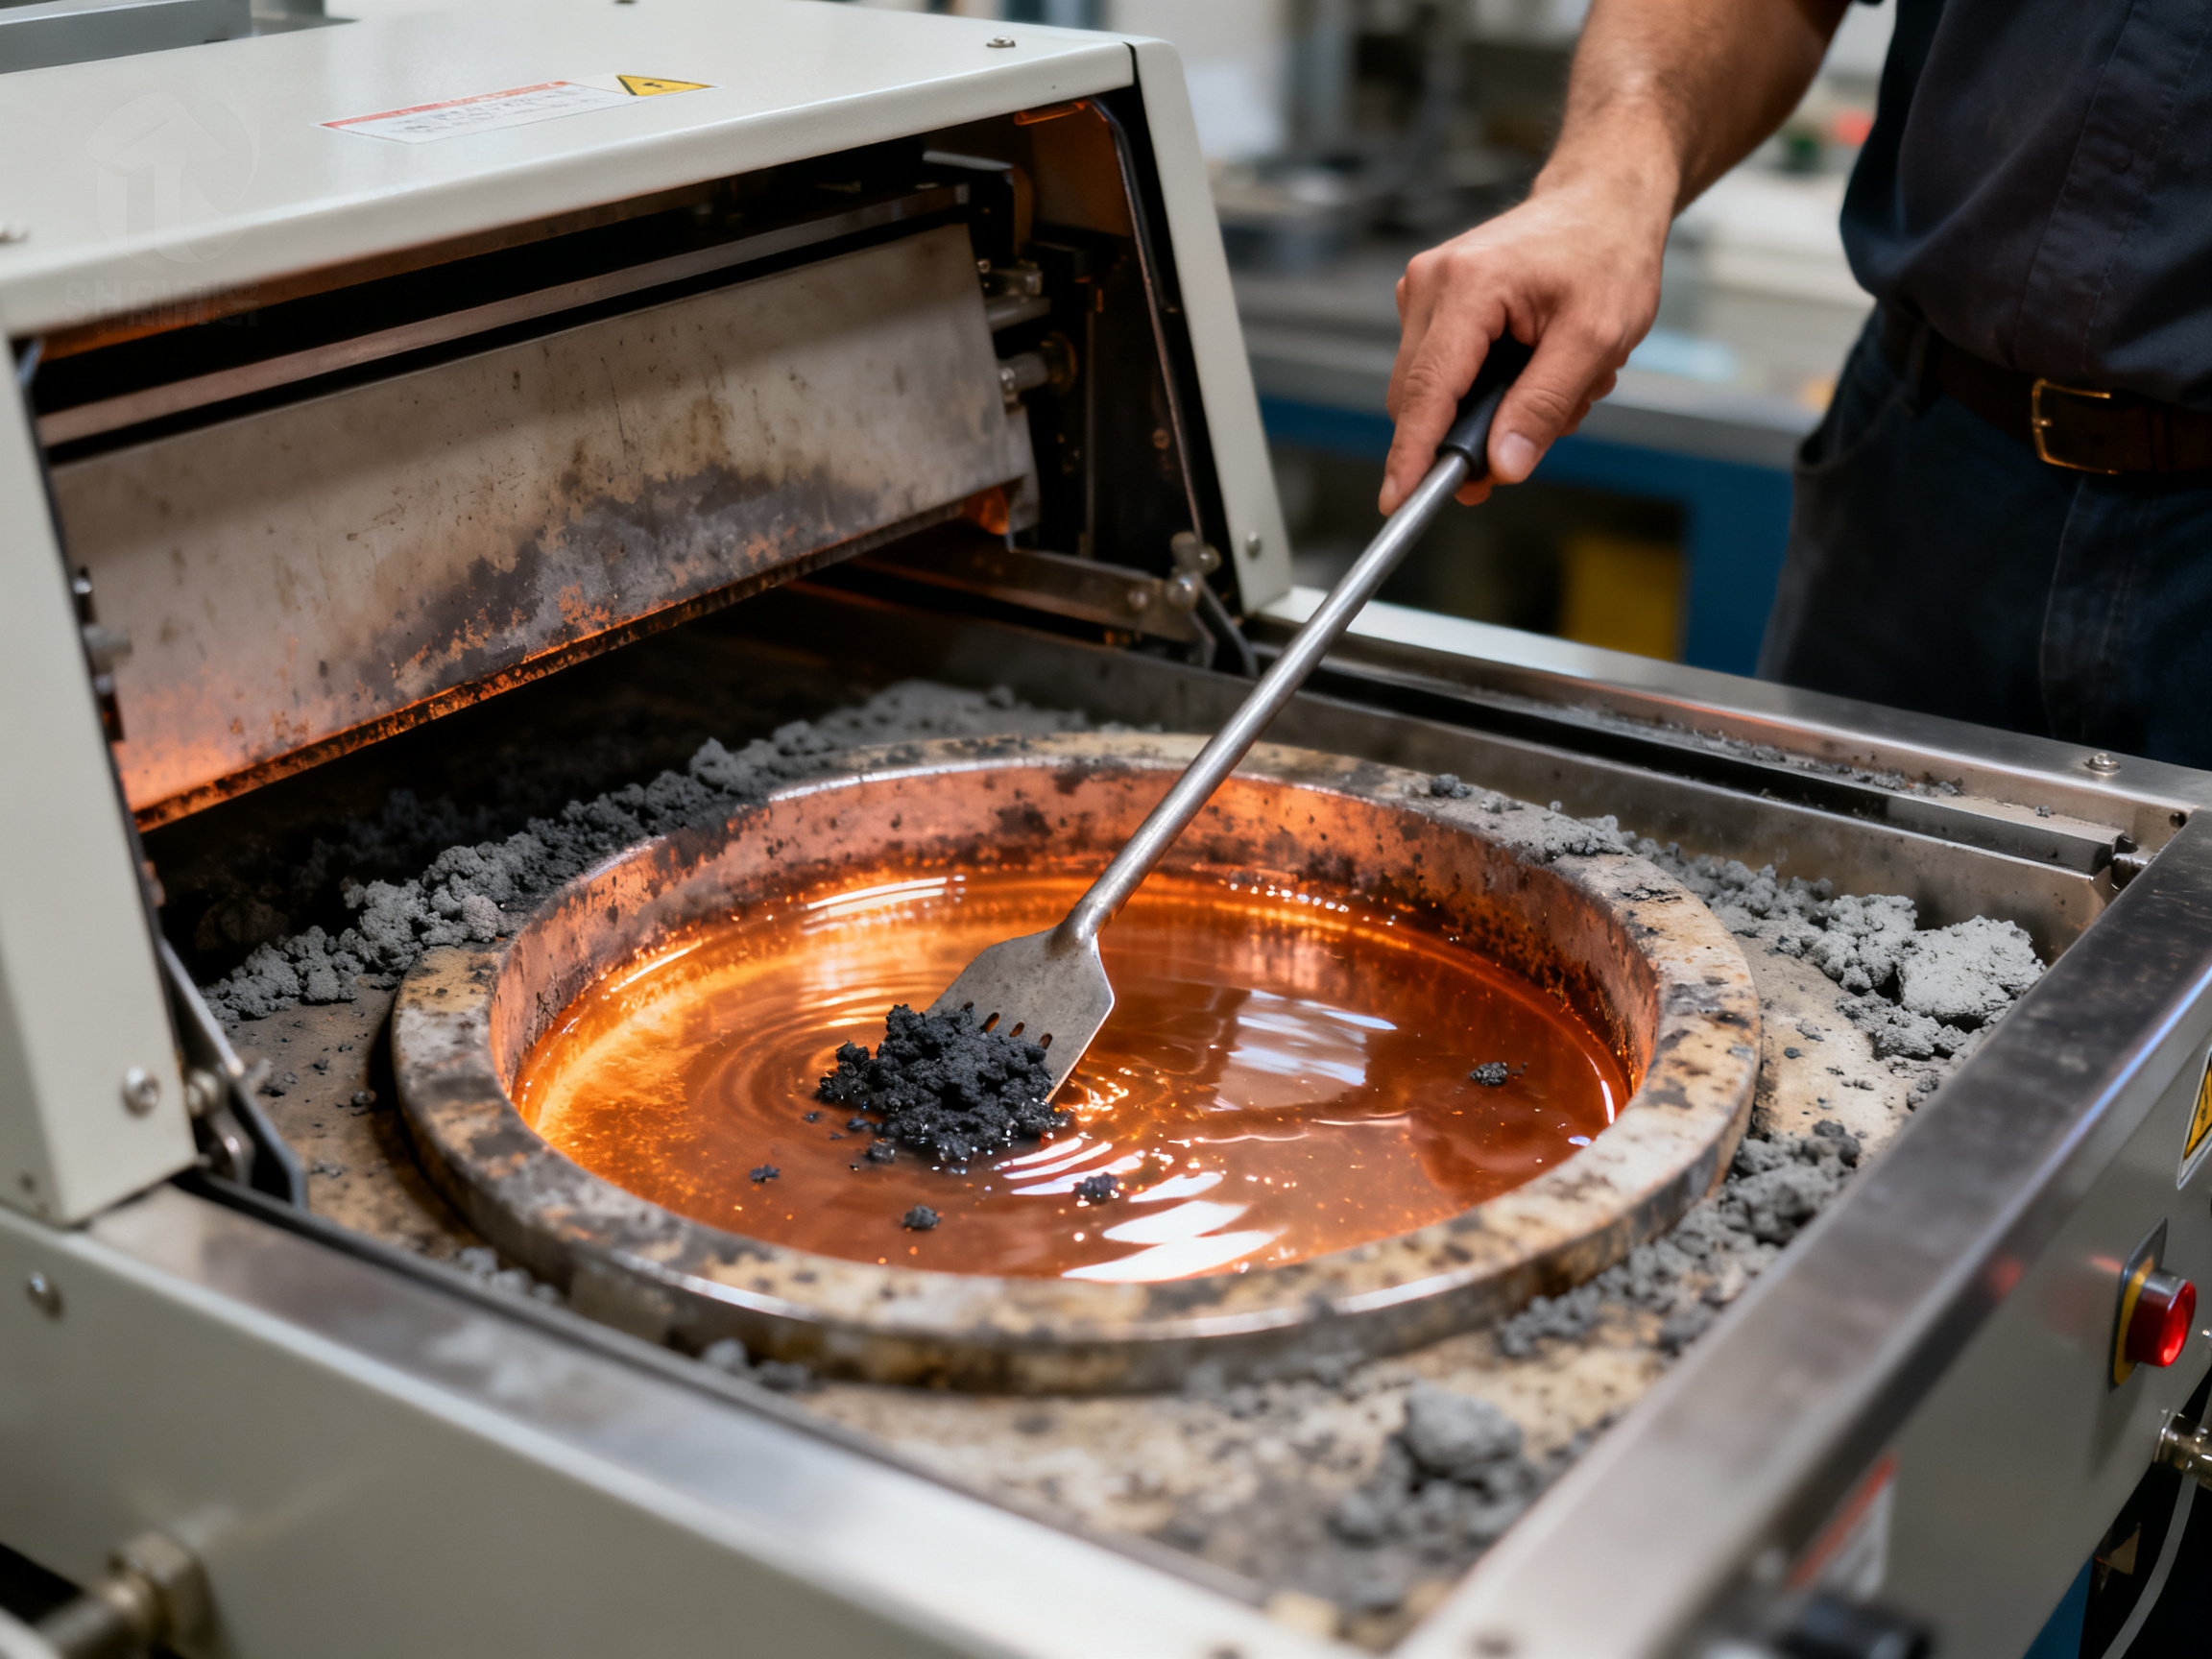
A practical maintenance interval should be based on the alloy, flux, operating temperature, and production volume rather than on a generic calendar rule. Record the condition of the pot before and after cleaning so that the effect of maintenance on profile stability can be evaluated.
Use a scheduled profile verification
Perform product-level thermal profiling at startup, after a major recipe change, after equipment maintenance, after a solder or flux change, and at a frequency justified by process risk and production volume. For stable high-volume lines, a scheduled verification can be complemented by routine checks with a traceable reference board.
Manage transitions
Product changes can temporarily alter the thermal load. When switching between board families, use a defined transition plan. Avoid running an unrepresentative mix of boards when establishing a baseline profile. If the line must run multiple products, validate representative profiles for each product family and define how the recipe transitions between them.
Train operators around corrections, not guesses
Operators should know the approved response to a low or high temperature indication, a failed wave-height check, an abnormal preheat reading, or a product-profile deviation. The response should include:
- Confirm the measurement and the machine status.
- Check the recipe and recent changes.
- Inspect the pot, wave, conveyor, and board condition.
- Refer to the approved troubleshooting procedure.
- Re-profile or quarantine affected product when the profile is outside the limit.
- Document the event and verify the correction.
Do not simply increase the pot temperature after every cold-joint complaint. That can mask a wave problem, damage components, accelerate dross formation, and reduce the remaining control margin.
5. Common Misconceptions
“255°C is the correct temperature for every board”
No. The correct value depends on the alloy, flux, board construction, thermal mass, wave conditions, and product profile. A nominal recipe may be correct for one assembly and excessive for another.
“The pot thermocouple is the most accurate joint measurement”
Not necessarily. It is an accurate measurement of its own location under its own conditions. It cannot describe the full board profile or the temperature at every joint.
“A higher pot temperature always improves wetting”
No. Higher temperature can improve melting and wetting when the process is genuinely too cold, but it can also oxidize the solder, damage flux and components, increase dross, and conceal an unstable wave.
“A cold joint means the conveyor is too slow”
A cold joint can result from insufficient wave contact, low preheat, low or disturbed wave height, a short dwell time, poor flux activity, contaminated solder, or an unsuitable joint design. The thermal profile and process inspection should identify the dominant cause.
“Once a board passes inspection, the profile is stable”
Inspection is a sampling check, not a continuous thermal measurement. Process stability requires trend monitoring, equipment control, product profiling, and documented change control.
6. A Simple Troubleshooting Table
| Observation | Likely areas to check | Corrective action to verify |
|—|—|—|
| Joints are cold, rough, or insufficiently wetted | Wave height, dwell time, preheat, solder condition, flux | Confirm wave stability, review the product profile, inspect the pot and flux, and correct one controlled variable at a time |
| Solder bridges between fine-pitch leads | Wave turbulence, excessive solder volume, board alignment, thermal profile | Check nozzle condition, wave height, conveyor alignment, and recipe limits |
| Excess dross or rapid pot-temperature recovery | Contamination, high temperature, exposed wave, poor skim practice | Inspect pot and nozzle condition, verify temperature control, and review alloy and flux handling |
| Component overheating | Preheat, total heat input, conveyor speed, fan settings | Re-profile the board and verify component temperature limits |
| Defects appear only after a recipe change | Change authorization, mixed products, transition plan | Quarantine affected boards, repeat the approved profile, and update the transition procedure |
| HMI temperature is stable but the joint result varies | Wave shape, product variation, sensor location, board loading | Compare product-level profiles and inspect the wave across multiple boards and positions |
Final Recommendation
Treat wave soldering temperature as a measured and controlled process profile, not as a number to chase on the HMI. The most reliable line is one that combines a defined recipe, representative product profiling, machine-level trending, pot and wave maintenance, objective inspection, and documented corrections.
When you are asked, “What temperature should the wave soldering machine run at?” the professional answer is: the temperature that produces a qualified product profile for the specific board and assembly, with the machine operating inside a proven control window. Verify the profile, inspect the joints, and let the evidence—not the display—determine the recipe.
Written by the process engineering team at S&M Co. Ltd. (Shenzhen Chuxin Electronic Equipment Co., Ltd.), a manufacturer of lead-free reflow ovens, wave soldering machines, and complete SMT production lines. Our engineers design and commission thermal processes for high-density assembly lines serving consumer electronics, semiconductor, automotive, and military production, including BGA and QFN defect reduction work and lead-free conversion projects across Asian and North American factories. This guide pulls from that hands-on commissioning work rather than from theory alone.## About the Author
Written by [Author Name], [Title] at S&M Co. Ltd., which trades internationally as Shenzhen Chuxin Electronic Equipment Co., Ltd. We build lead-free reflow ovens, wave soldering machines, and complete SMT production lines for factories running high-volume electronics assembly.
The work behind this guide is thermal process design and line commissioning for consumer electronics, semiconductor, automotive, and military production. That covers BGA and QFN defect reduction, lead-free conversion projects, and pot temperature troubleshooting on lines across Asia and North America.
So expect field practice here, not generic advice. Every method described in this guide was used on a live line, measured with a thermocouple, and cross-checked against joint inspection before it made it into print. If you take one thing from it, take this: the number on the HMI is a clue, and the profile is the evidence.
Author photo, S&M company logo, and LinkedIn profile link are placed alongside this bio in the published version.## 1. Why Wave Soldering Machine Temperature Is the Single Biggest Lever on Defect Rate
Ask any wave soldering process engineer what causes the most rework, and temperature usually comes up first. Not because every defect is thermal, but because temperature is the variable that quietly changes everything downstream of it.
Here is the chain, and it runs one direction. Pot temperature and dwell time decide whether the solder is molten and how much energy it carries. Molten state decides whether solder wets the lead and barrel or sits there as a cold lump. Wetting decides whether the joint ends up with a smooth fillet, a dull crater, a bridge, or a hole that is only half full. And the joint you end up with sets the rework labour cost, the scrap cost, and the field return rate. Change the temperature and you change all four.
We have run lines where the recipe was copied from a previous job and never questioned. The “good” temperature was 250°C on a small telecom board with light copper. The same 250°C went onto a dense controller board with large ground planes, and cold joints appeared in the first shift. Nothing about the machine changed. The board did.
From Our Experience: Most “temperature too high” complaints we get to a line are actually preheat ramp-rate and soak-time problems. You can diagnose this in under ten minutes at the machine. Put a contact thermocouple on the board top, run a board at production speed, and watch the preheat trace. If the board is still climbing steeply when it reaches the wave, the “hot pot” is the wrong suspect. Slow the ramp or extend the soak, then re-run. In most cases the pot reading never needs to move.
The heat chain, step by step
Before the board ever touches solder, preheat brings the PCB and component bodies up toward soldering temperature. That reduces the temperature differential the joint has to survive, which cuts thermal shock on ceramic bodies and multilayer boards. During wave contact, liquid solder becomes the dominant local heat source for the wave-facing copper: the pad, the plated barrel, and the exposed lead. The top-side fillet then heats by conduction up through the lead and plated through-hole. After that, controlled cooling locks in the joint.
Notice that there are three different temperatures in that sentence: preheat temperature, pot temperature, and the temperature at the joint. They are not interchangeable, and the third one is the only one a customer cares about. But it is also the hardest one to read, which is why good lines measure it instead of guessing it.
Why one global setpoint fails on multi-variant lines
Here is the trap for high-volume shops running several board families through one machine. Heat absorption scales with copper mass, and copper mass varies wildly between products. A smartphone PCB with a full ground pour, a dense QFN carrier with large pads, and a thin sensor board with mostly signal traces do not heat the same way at all. Large planes and thick barrels sink energy, so local joint temperature lags the pot reading. Small isolated pads heat fast and can overshoot relative to the rest of the board.
Then there is component density, board thickness, pallet and carrier mass, orientation on the conveyor, and how long the board actually sits in the wave. Change the conveyor speed and you change preheat time, dwell time, and cooling time all at once. Run a heavier product variant at a speed qualified for a lighter one and the whole thermal history shifts. One global number cannot cover that.
If you want numbers to anchor the discussion, the honest ones are the operating ranges printed in process literature: roughly 250 to 260°C pot temperature, 100 to 150°C board-top preheat, and 2 to 5 seconds of wave contact for lead-free work. Treat those as starting points for a design experiment, not acceptance limits. What matters for your line is the measured profile on your boards.
Where the standards fit, and where they don’t
A word on standards, because it comes up in every audit. IPC J-STD-001 is a soldering process and materials standard. It covers thermal control, flux control, bath contamination, and the expectation of documented, repeatable parameters rather than operator improvisation. IPC-A-610 is different in kind. It judges whether the finished assembly is acceptable: fillet shape, bridging, hole fill, icicles, solder balls, component and board damage, across Classes 1, 2 and 3.
Read together, they answer two different questions. Was the joint acceptable? That is A-610. Was the process controlled? That is J-STD-001. Neither one tells you that your machine should run at 255°C. IPC-A-610 acceptance and a qualified process profile are related, but they are not interchangeable. A board can pass visual inspection while the process is drifting, and a profile can sit inside its window while a joint still fails on flux coverage, geometry, or contamination.
One caution for 2026: confirm the current revision with IPC directly before you cite a clause number in any documentation. Different listings show different revisions, including J-STD-001 Revision H and Revision J, and you want your paperwork to match your licensed copy.
The defect to root cause matrix
| Defect mode | Temperature-related root cause | Non-temperature root causes to rule out | First check |
|—|—|—|—|
| Cold or non-wetting joint | Pot below alloy working range, preheat too low, dwell too short | Flux activity or coverage, oxidized pot, pad oxidation, joint geometry | Wave contact time and solder condition |
| Bridging between fine-pitch leads | Excessive thermal input, slow conveyor, turbulence | Lead spacing, pad geometry, wave height and nozzle condition, orientation | Wave shape and board alignment |
| Insufficient hole fill | Insufficient energy for copper mass, dwell too short, cold board | Hole and lead size mismatch, paste or solder volume, board thickness | Product profile at the barrel |
| Dross and excess waste | Pot above alloy limit, exposed wave, long machine-on hours | Contamination, flux residue, skim cadence, air agitation | Pot condition and machine-on hours |
| Component overheating | Total heat input too high, slow conveyor | Component placement, missing shadowing, package orientation | Package body temperature on the profile |
| Defects only after a change | Recipe changed without re-qualification | Mixed product load, transition plan, operator entry error | Change log and product mix |
Use this as a starting hypothesis list, not a verdict. We have found plenty of “temperature” defects that were actually flux or wave-shape problems, and plenty of “flux” defects that were a preheat soak too short to activate it.
Expert Tip: Track the one number that predicts your next maintenance event: machine-on hours at temperature, not calendar days. A pot running 16 hours a day at 255°C degrades dross and oxides far faster than one running four hours a day, so the cleaning interval that works for the first pot will burn the second one. Log machine-on hours against skim events and set the cadence from that data.
The honest limit on percentages
You will see charts claiming a share of wave solder defects comes from temperature. We would push back on any of them, including ours. There is no defensible industry-wide percentage in the public literature that splits wave solder defects between thermal deviation, flux, placement, PCB layout, and contamination. Those numbers are usually made up or copied from a single plant with an unstated product mix and an unstated defect definition.
What works is site-specific Pareto analysis. Define your defect taxonomy, record the actual profile at representative board locations, link each defect to board coordinates, orientation, component family, flux lot, bath chemistry, and machine settings, then confirm the suspected cause with a controlled trial. Report denominators. We would also measure your manual recording accuracy directly, because on older machines with analogue gauges and hand-written setpoint logs, transcription errors are real and easy to undercount. One operator copying yesterday’s value into today’s log looks exactly like a stable process.
What we can say with confidence is this: wave soldering machine temperature is the lever with the widest reach, and it is the lever most often set by habit rather than by measurement. If you want to know how wave soldering temperature changes defect rates on your line, this is where the answer starts.
Ready to see what a properly instrumented wave soldering setup looks like? S&M Co. Ltd. (Shenzhen Chuxin Electronic Equipment Co., Ltd.) builds wave soldering machines, lead-free reflow ovens, and full SMT lines with the profiling and recipe control built in, so the temperature story is visible on the HMI instead of buried in a notebook. Talk to our engineers about qualifying a profile for your own board mix.## 3. How Wave Soldering Temperature Is Measured
Temperature measurement is where most wave-soldering troubleshooting becomes useful—or misleading. The machine can display a pot temperature, the conveyor can report a recipe setting, and the process engineer can record a thermal profile, but these are not interchangeable measurements.
To understand how wave soldering temperature is measured, start with the question you need to answer:
- Are you confirming that the molten solder is at the intended pot temperature?
- Are you checking how quickly the PCB reaches soldering temperature?
- Are you measuring the temperature experienced by a component body?
- Are you calculating the time and temperature a specific joint sees during wave contact?
Each question requires a different measurement point and a different instrument.
Pot temperature: measuring the process, not the joint
The pot thermocouple sits inside the solder pot. It is normally read by the machine control system and displayed on the HMI. This is the easiest temperature to obtain, but it describes only the bulk solder around the sensor.
Pot temperature is still important. It determines whether the alloy is fully molten and strongly influences how quickly it transfers heat to the board. However, it does not tell you the temperature of the board, the lead, the pad, or the component body. The pot may also have gradients, especially near the walls, at the pump inlet, or between operating and standby conditions. A reading from one location may not represent the part of the wave contacting the board.
For routine control, verify the displayed value against a calibrated reference thermometer in the working area of the pot. For troubleshooting, also ask whether the sensor is positioned in active solder flow or in a relatively stagnant region. A sensor reading low in the pot can produce a misleadingly low display without representing the temperature of the wave.
Do not confuse a healthy machine display with a useful board profile. A perfectly controlled pot at 260 °C can still produce unacceptable results if the PCB arrives too cold, climbs too quickly, or spends too long in the wave.
Contact thermocouples: the direct way to profile a board
A contact thermocouple is attached to the board at a location of interest, and its signal is recorded as the board moves through the machine. The resulting graph normally includes:
- Time in the machine
- Preheat temperature
- Peak temperature
- Time at or above a selected threshold
- Ramp rate
- Cooling rate
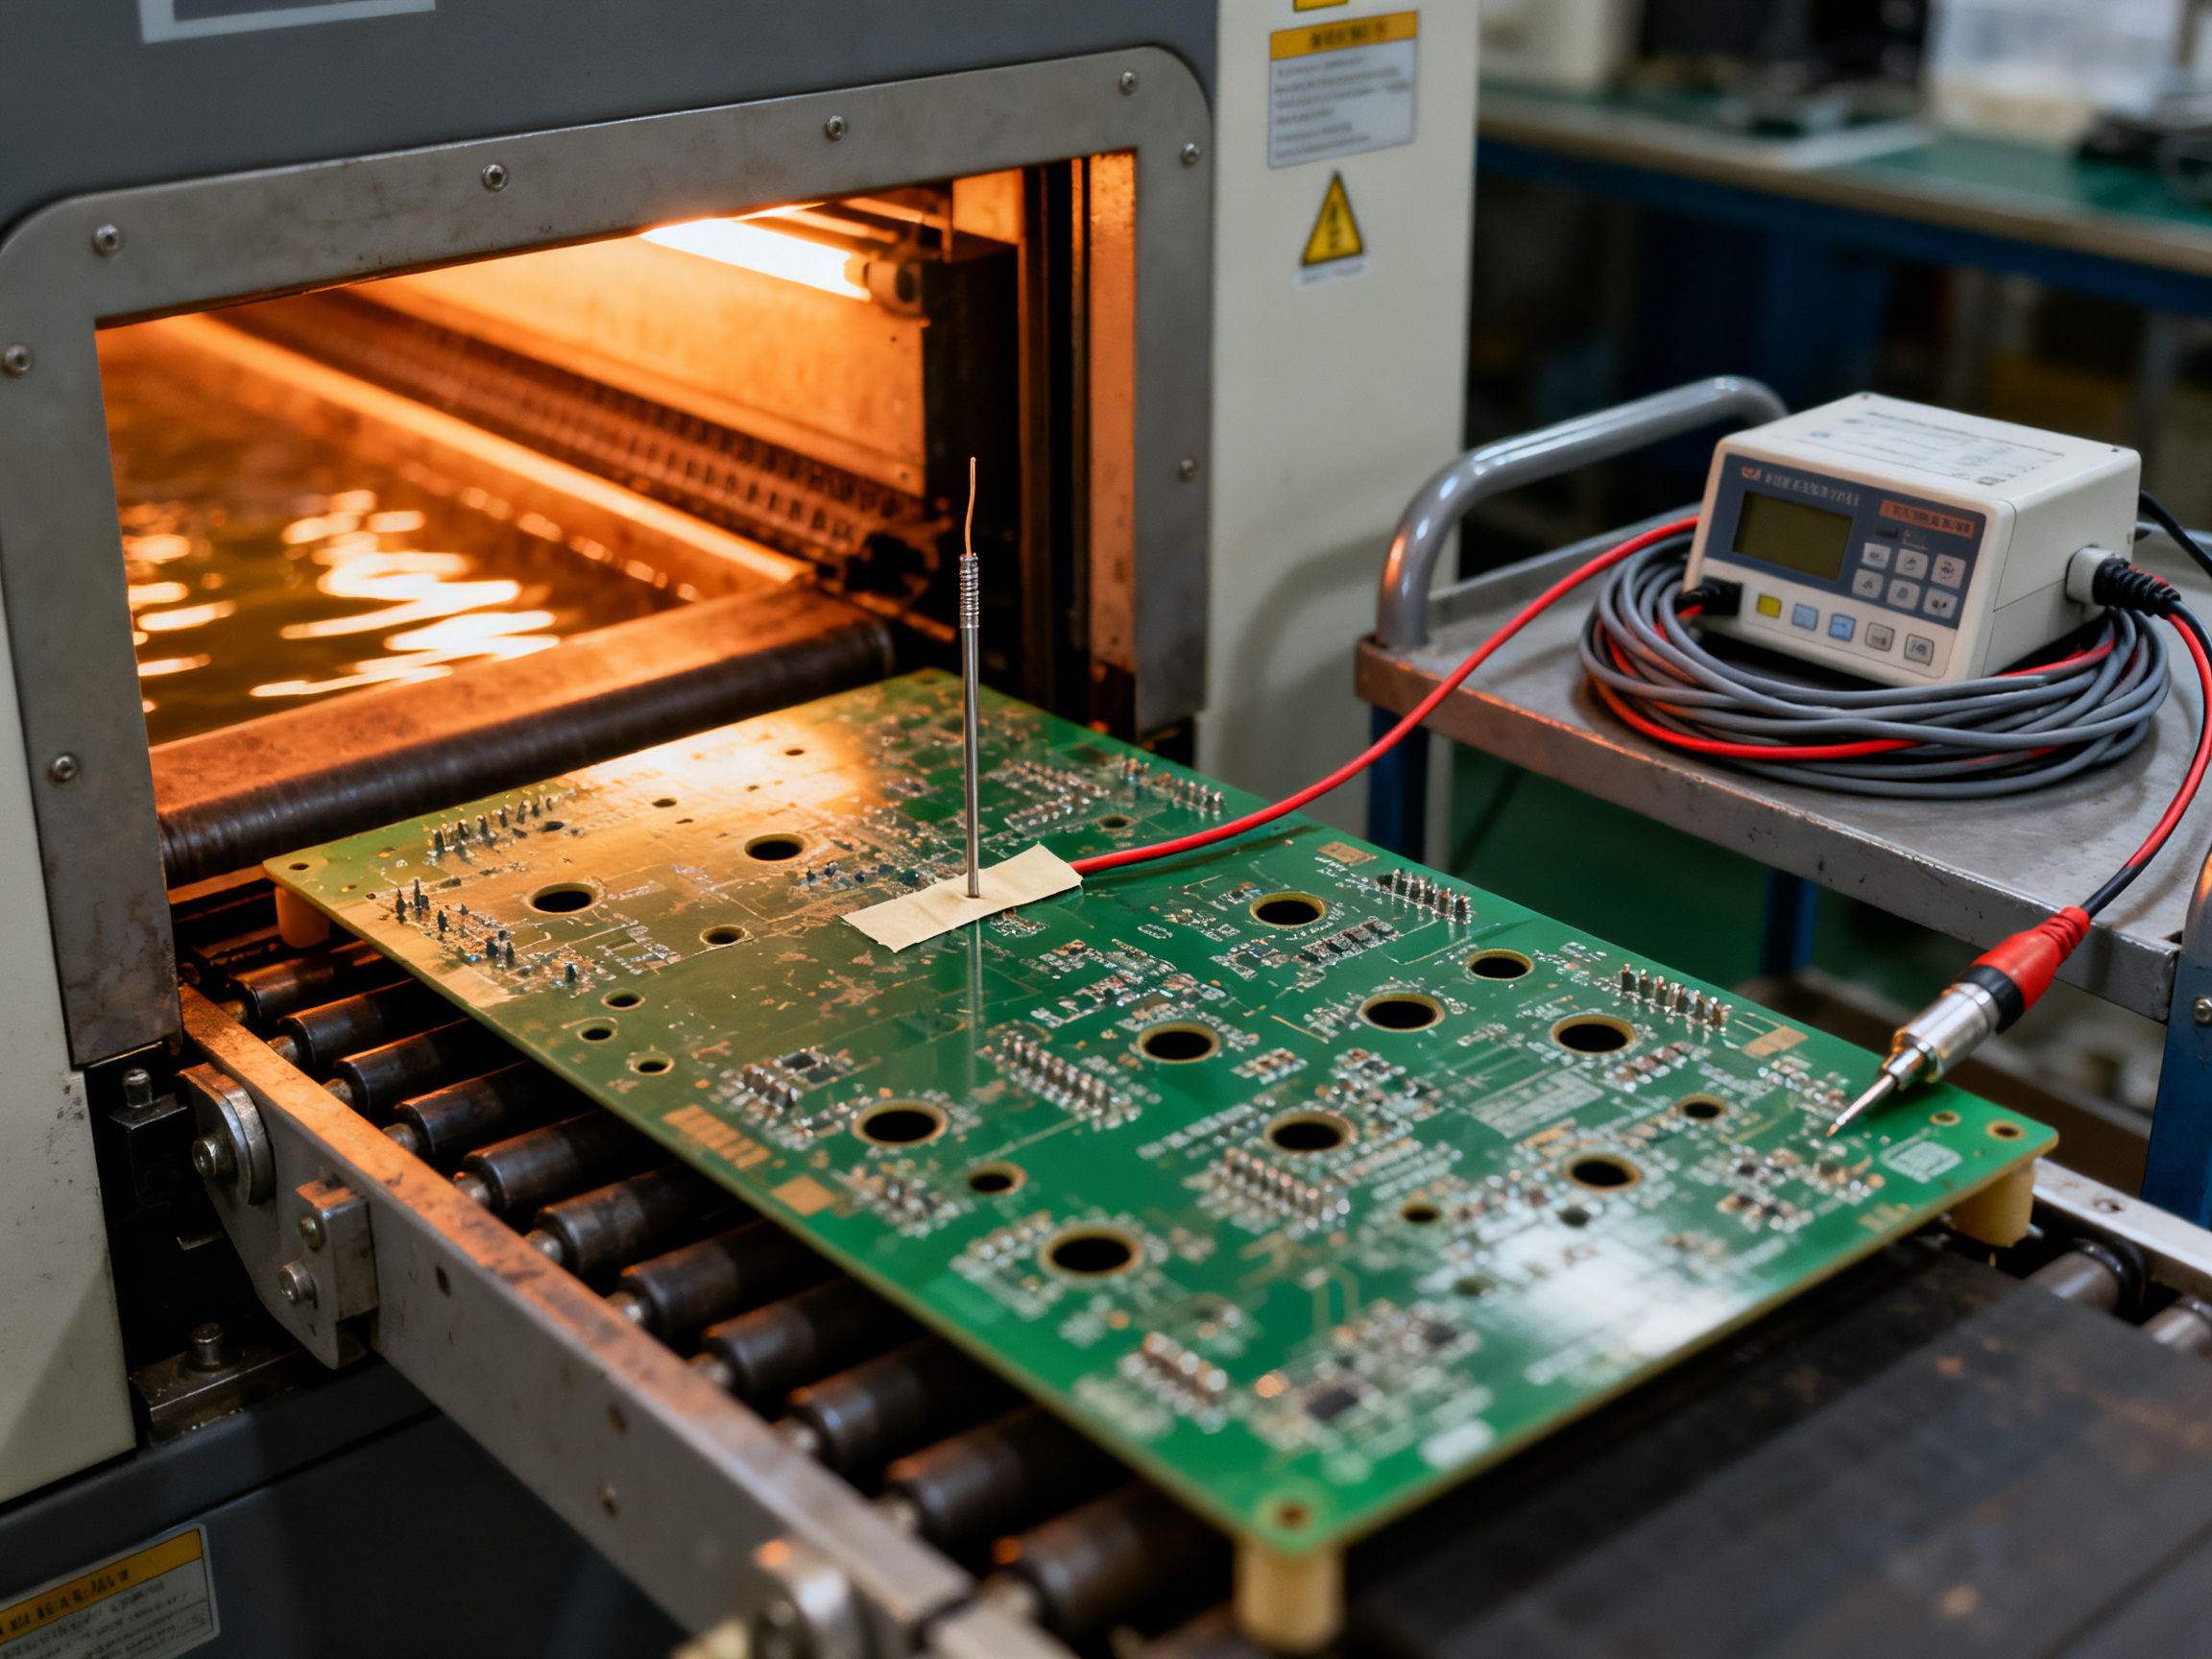
The probe should be robust enough to remain attached during a production-speed run without changing the contact geometry of the joint. The wire should be routed so that it does not pull on the component, snag on the wave, or create an unintended heat path near the measurement point.
For a through-hole process, the useful measurements often include:
| Measurement location | What the trace reveals | Why it matters |
|—|—|—|
| PCB top near the component body | Component and board heating during preheat | Helps evaluate thermal shock and component exposure |
| Underside of the PCB | Board temperature at wave contact | Shows the starting condition for the joint |
| Component lead or terminal | Local joint-contact temperature | Indicates how quickly the lead heats during immersion |
| Pot or wave area | Actual solder temperature | Provides context for the heat-transfer conditions |
| Exit side of the cooling section | Cooling rate | Helps identify thermal-stress risk after soldering |
AIM recommends profiling with at least three thermocouples, including a run through the PCB to the underside so the solder-contact temperature and time can be evaluated AIM wave solder profile supplement. In practice, the most informative profile is often one that includes the component body, the underside of the board, and the solder pot or wave.
Where to attach the probe
Placement determines what the profile means. A probe under the board shows the board’s thermal condition, but it does not automatically show the temperature at every joint. A probe on a large copper area may also respond more slowly than the same probe on a small pad because copper distributes heat across the board.
Follow these principles when selecting a location:
- Profile the worst-case assembly. Include the largest component body, the thickest thermal mass, and the most sensitive component in the build.
- Use representative copper features. A measurement on a narrow trace may not represent a joint connected to a large ground plane.
- Keep the sensor electrically isolated. Use an approved attachment method and confirm that the probe, wire, and attachment material are suitable for the process temperature.
- Do not obstruct the wave. The board must travel through the solder in the same orientation and at the same speed used in production.
- Repeat the placement if the product mix changes. A profile that is valid for one board family is not automatically valid for another.
For long-leaded or heat-sensitive components, measure as close as practical to the package-body region rather than relying only on the pot reading. A probe placed on the terminal may show a higher temperature than the body, while a probe under a package may underestimate exposure at the lead root. When space permits, a two-probe comparison gives a much clearer picture.
Choose the right measurement threshold
A peak temperature by itself is not a complete process specification. The profile should be evaluated against the component manufacturer’s limits for:
- Peak package or body temperature
- Time at or above temperature
- Ramp rate into the wave
- Maximum temperature difference between the board and the joint
The profile threshold is not the same as the soldering temperature. For example, a limit such as 260 °C may describe the maximum temperature permitted for a particular component in a qualified process. It does not mean that every point on every board should reach 260 °C, nor does it authorize a package body to be immersed in the wave.
The limits must come from the component manufacturer. Texas Instruments’ through-hole guidance provides both a maximum soldering temperature and ramp-rate considerations for its cited profile TI through-hole soldering application note. Your own component data sheet may specify a different limit.
Infrared cameras: excellent for comparisons, difficult for absolute values
An infrared camera can show the temperature distribution across a board without a contact sensor. This makes it useful for locating hot spots, comparing regions, and identifying uneven heating.
The same feature creates a major limitation. An IR camera does not directly measure a joint’s true surface temperature. It calculates an apparent temperature from the radiation detected by the camera. The result depends on:
- Emissivity of the target
- Reflections from surrounding surfaces
- The viewing angle
- Whether the surface is oxidized, coated, wet with flux, or covered by solder
- The presence of hot solder or reflected infrared energy
- The camera’s calibration and focus
Bare polished copper has low emissivity and can produce badly misleading results. Dark component bodies generally behave differently from shiny pads, so two regions that appear at the same color in an IR image may not actually be at the same temperature.
IR is most useful as a comparative tool. Place the board in the same orientation in every run, use consistent focus and exposure, and compare like surfaces. Do not accept an absolute temperature from an IR image unless the camera setup, emissivity, and reflected-temperature conditions have been properly established.
A practical hybrid method is to combine IR imaging with a contact probe:
- Use IR to identify the hottest or most uneven region.
- Attach a contact thermocouple to that region.
- Use the contact trace as the quantitative reference.
- Use the IR image to document how repeatable the condition is across the assembly.
This combination often finds problems faster than either method alone. A thermocouple tells you what happened at one point; IR tells you whether that point represents the rest of the board.
How to build a useful wave-soldering profile
A repeatable profile procedure matters more than having a sophisticated recorder. The following sequence works for most production troubleshooting.
1. Establish the baseline
Run a representative assembly using the current production recipe. Record the pot temperature, conveyor speed, preheat settings, board orientation, flux condition, and component placement. If the process is not stable, improve repeatability before interpreting small temperature differences.
2. Attach the sensors
Prepare enough thermocouples to measure the critical locations. Secure each probe without changing wave contact, and route the wires away from the solder surface. Make sure the board can pass through the machine without the wires lifting it out of the wave.
3. Run at production speed
Profile at the actual conveyor speed used in production. A slower test run changes the time-temperature history and can conceal rapid heating or excessive dwell.
4. Capture the full thermal history
The recording should begin before the board enters the first active heating zone and continue until the assembly has cooled sufficiently. The preheat segment is often more important than the final peak: it controls how much thermal shock the board and component will experience at wave entry.
5. Compare the trace with product limits
Mark the manufacturer limits on the profile and calculate the relevant values: peak temperature, ramp rate, time above threshold, temperature difference at wave entry, and dwell time. Evaluate the component body separately from the solder-contact temperature.
6. Change one variable at a time
When the profile is outside limits, adjust one factor—such as conveyor speed, preheat temperature, or soak time—and repeat the run. Changing several variables simultaneously makes it impossible to identify which change corrected the issue.
Reading common profile shapes
A steep rise immediately before the wave
This usually indicates insufficient preheat or too little soak. The board is still absorbing heat rapidly when it meets the solder, increasing thermal shock at the pad, barrel, and component body.
Before changing the pot temperature, try:
- Increasing the preheat target slightly
- Extending the effective preheat time
- Reducing the conveyor speed if that produces acceptable cycle time
- Checking whether large copper masses are taking longer than expected to heat
A long, high-temperature soak
This may occur when the board dwells too long in the preheat zone or when a large thermal mass absorbs energy slowly. Components may remain at elevated temperature for an extended period before reaching the wave.
A longer soak is not automatically safer. Flux can dry out, oxidation can increase, and thermally sensitive packages can be exposed to heat longer than intended. The correct adjustment depends on the component limits and the flux activation requirement.
A narrow peak with a short dwell
This may be normal for a lead-rich or low-thermal-mass assembly, but it can leave insufficient time for the plated barrel and pad to reach the required wetting temperature. Depending on the failure mode, the remedy may be a small dwell-time increase rather than a higher pot temperature.
Check the underside and lead temperatures before making that change. If the wave-contact temperature is already appropriate and the component limit is tight, increasing pot temperature may add risk without improving the joint.
Rapid cooling after wave contact
A sharp drop immediately after the wave can create stress in the component, board, and joint. The cooling trace should be compared with the board construction and component ratings. Slower cooling is not always possible without reducing throughput, so process changes must be balanced against production requirements.
Measurement errors that create false conclusions
Most incorrect temperature diagnoses fall into a small number of categories.
Attaching the probe to the wrong feature. A trace on a large copper plane behaves differently from a trace on the actual pad. The sensor location must represent the joint or component being investigated.
Using production settings during a test run at reduced speed. Slower conveyor speed increases total exposure and changes the preheat-to-wave relationship. Profile at the speed that will be used for production.
Treating the HMI value as the board temperature. The pot reading and the profile reading answer different questions.
Relying on an uncalibrated IR setting. Apparent temperature on shiny metal can be wrong by a large margin.
Measuring only the peak. A profile can have an acceptable peak while still violating a ramp-rate or time-at-temperature limit.
Profiling an easy board after a field failure. The failed assembly may differ in copper mass, component orientation, placement, or incoming temperature. Profile the actual material if the geometry has changed.
Ignoring flux and board condition. A wet, recently assembled board can behave differently from a dry board. Surface condition, storage time, and cleaning history can affect both the thermal response and the heat-transfer behavior.
Comparing profiles made with different sensors. Probe type, attachment method, and sampling rate can alter the apparent trace. Keep the measurement configuration consistent.
Turning the profile into a controlled recipe
The purpose of profiling is not to create a decorative graph. It is to establish operating limits that the process can repeat.
A controlled wave-soldering recipe may specify:
- Solder alloy and pot-temperature range
- Conveyor speed and resulting wave-contact time
- Preheat target range
- Maximum acceptable ramp rate
- Minimum soak or preheat time
- Component-body temperature limit
- Maximum time above specified thresholds
- Flux condition and application method
- Orientation and clearance requirements
- Actions required when any measurement leaves the range
Where the process is stable, set the machine controls close enough to the qualified center of the operating window to preserve margin. Wide limits may allow more variation than the finished product can tolerate.
Recheck the profile after changes to the solder alloy, PCB stack-up, component mix, conveyor configuration, flux, or machine maintenance. Even when no product has changed, a drifted thermocouple, blocked nozzle, uneven preheat airflow, or modified wave height can move the process.
The practical answer
How wave soldering temperature is measured depends on what you are trying to control. The pot sensor measures the bulk solder. A contact thermocouple measures the actual time-temperature history at the board, lead, or component body. An IR camera is best for comparing spatial differences, but it is vulnerable to emissivity and reflection errors.
For dependable troubleshooting, use the pot reading to verify machine control, contact thermocouples to quantify the board and component profile, and IR imaging to identify nonuniform conditions. Then judge the result against the component manufacturer’s limits and the repeatability of the complete process.
The next section turns those measurements into practical control: choosing pot temperature, conveyor speed, and preheat settings without turning a machine setting into a substitute for a valid process profile.## 4. The Wave Soldering Temperature Profile: Preheat, Soak, Wave, and Cooling Explained Step by Step
Most people think of wave soldering temperature as a single number on the HMI. It is not. What actually touches your board is a time-temperature curve, and the curve has four distinct stages. Each one can ruin a joint on its own, even when the pot reading looks perfect.
Understanding how wave soldering temperature works means reading that curve instead of chasing a setpoint.
The four stages
Preheat ramp. The board enters the preheat zone cold and climbs. The ramp rate is the number to watch. A fast ramp, roughly 1 to 3 °C/s depending on board mass, drops the temperature difference the board must survive at wave entry, and that difference is what cracks ceramic packages and delaminates multilayer boards. Slow ramp, more soak time, same peak.
Soak and equalization. Here the board levels off. The soak drives moisture out of the assembly and equalizes component body temperatures so every part enters the wave at a similar state. For thermal-sensitive parts and boards with large copper mass, the soak matters more than the peak temperature ever will. A board with heavy ground planes still pulling heat out of the joint zone at wave contact will not be rescued by a hotter pot.
Wave contact. The short, intense part of the curve. Liquid solder becomes the dominant local heat source for the wave-facing pad, barrel, and lead, and the top-side fillet heats by conduction up through the lead. Industry process ranges put wave contact at roughly 2 to 5 seconds for lead-free work, and Kester’s SAC305 data gives a representative contact time near 2.3 to 2.8 s Kester SAC305 technical data sheet.
Controlled cooling. The last stage people forget. Too slow and you grow unwanted phases and coarse grain; too fast and you stress the joint. AIM’s profiling guidance treats cooling rate as a first-class measurement rather than an afterthought AIM wave solder profile supplement.
| Stage | Purpose | Typical range | Symptom if wrong |
|—|—|—|—|
| Preheat ramp | Reduce thermal shock at wave entry | 1 to 3 °C/s ramp | Cracked ceramics, delamination, lifted pads |
| Soak | Drive moisture out, equalize part temperatures | 100 to 150 °C board top | Dry-out cracks, uneven wetting, dull joints |
| Wave contact | Melt and wet the joint | 2 to 5 s contact, 250 to 260 °C pot | Cold joints, insufficient hole fill, bridging |
| Cooling | Lock in joint structure without stress | Controlled ramp-down | Stress cracks, large grain, brittle joints |
Mapping the profile onto machine zones 1 to 9
Zone numbers differ slightly between machine builders, but the logic holds. Zones 1 and 2 handle entry and initial preheat ramp. Zones 3 through 5 carry the soak and equalization plateau. Zone 6 is usually the flux application and wave entry region. Zone 7 is the wave and wave contact. Zones 8 and 9 cover exit and cooling.
The mistake we see most often is setting the machine zone by zone without ever looking at the resulting trace. The HMI says 120 °C in zone 4. The board top, measured with a thermocouple, might be at 95 °C at that moment because the board never equilibrated. Zone setpoints describe air in a chamber. The profile describes your product.
How to read a logger trace
Open the data logger file and look for four things.
- The ramp segment into the wave. Steep line, bad news.
- The plateau level. This is your real board-top preheat temperature, not the zone setpoint.
- The peak at wave contact, and how many seconds it sits above the alloy liquidus. Peak alone tells you very little.
- The cooling slope, compared against your board construction and component ratings.
Then overlay the component manufacturer’s limits. Texas Instruments’ through-hole guidance gives both a maximum soldering temperature and ramp-rate constraints for its cited profile TI through-hole soldering application note. Your own device data sheet may differ.
The practical takeaway
Measure the profile on a representative board at production speed. Read the four stages, not just the peak. Change one variable per run. And when the numbers look fine but the joints still fail, suspect the wave shape or the flux, because the profile already told you the temperature was fine.
Want a printable version of this stage-by-stage checklist for your line? S&M Co. Ltd. (Shenzhen Chuxin Electronic Equipment Co., Ltd.) can send it along with a wave soldering profile template, and our engineers can help you qualify a profile for your own board mix on an S&M wave soldering machine with the recipe logging and zone trending built in.