
Published: 16 November 2026
Last updated: 16 November 2026
Reading Time: 16 minutes
Reviewer: Lead-Free and RoHS Process Audit Specialist, S&M Co. Ltd. (named reviewer and certificate numbers to be confirmed by S&M’s marketing team before publication)
Written by: SMT Process Engineer, Shenzhen Chuxin Electronic Equipment Co., Ltd. (S&M Co. Ltd.) (author name and credentials pending assignment)
This guide walks through how a reflow oven temperature profile is built, measured, and kept on target, with a sharp focus on preventing PCB warpage during reflow. Every figure and profile window in this article points back to the paste technical data sheet, the component supplier’s thermal limits, and the applicable customer specification, not to a generic chart pulled from the internet. Where an industry figure is used, we say so plainly, and where the answer depends on your line, your board, and your parts, we tell you to measure it.
Note for the publisher: The reviewer and author lines above are placeholders that must be replaced with named personnel, verified certificates, and credential numbers before this article goes live. Experience claims in the sections that follow should be backed by S&M’s internal controlled records.## Introduction: Why the Reflow Profile Quietly Decides Your PCB Warpage Rate
Here is a shop floor scene I have seen more than once. A board comes out of the reflow oven at 7:40 on a Tuesday morning. It looks fine, so it goes straight to the next machine. Then the placement head reaches a little farther than it should, because the board is bowed a fraction. Nothing fails on the line. The problem turns up two hours later in final test as an open joint on a BGA corner, and the whole line stops to find out why.
Nobody connects that failure back to the oven. But the oven set it up.
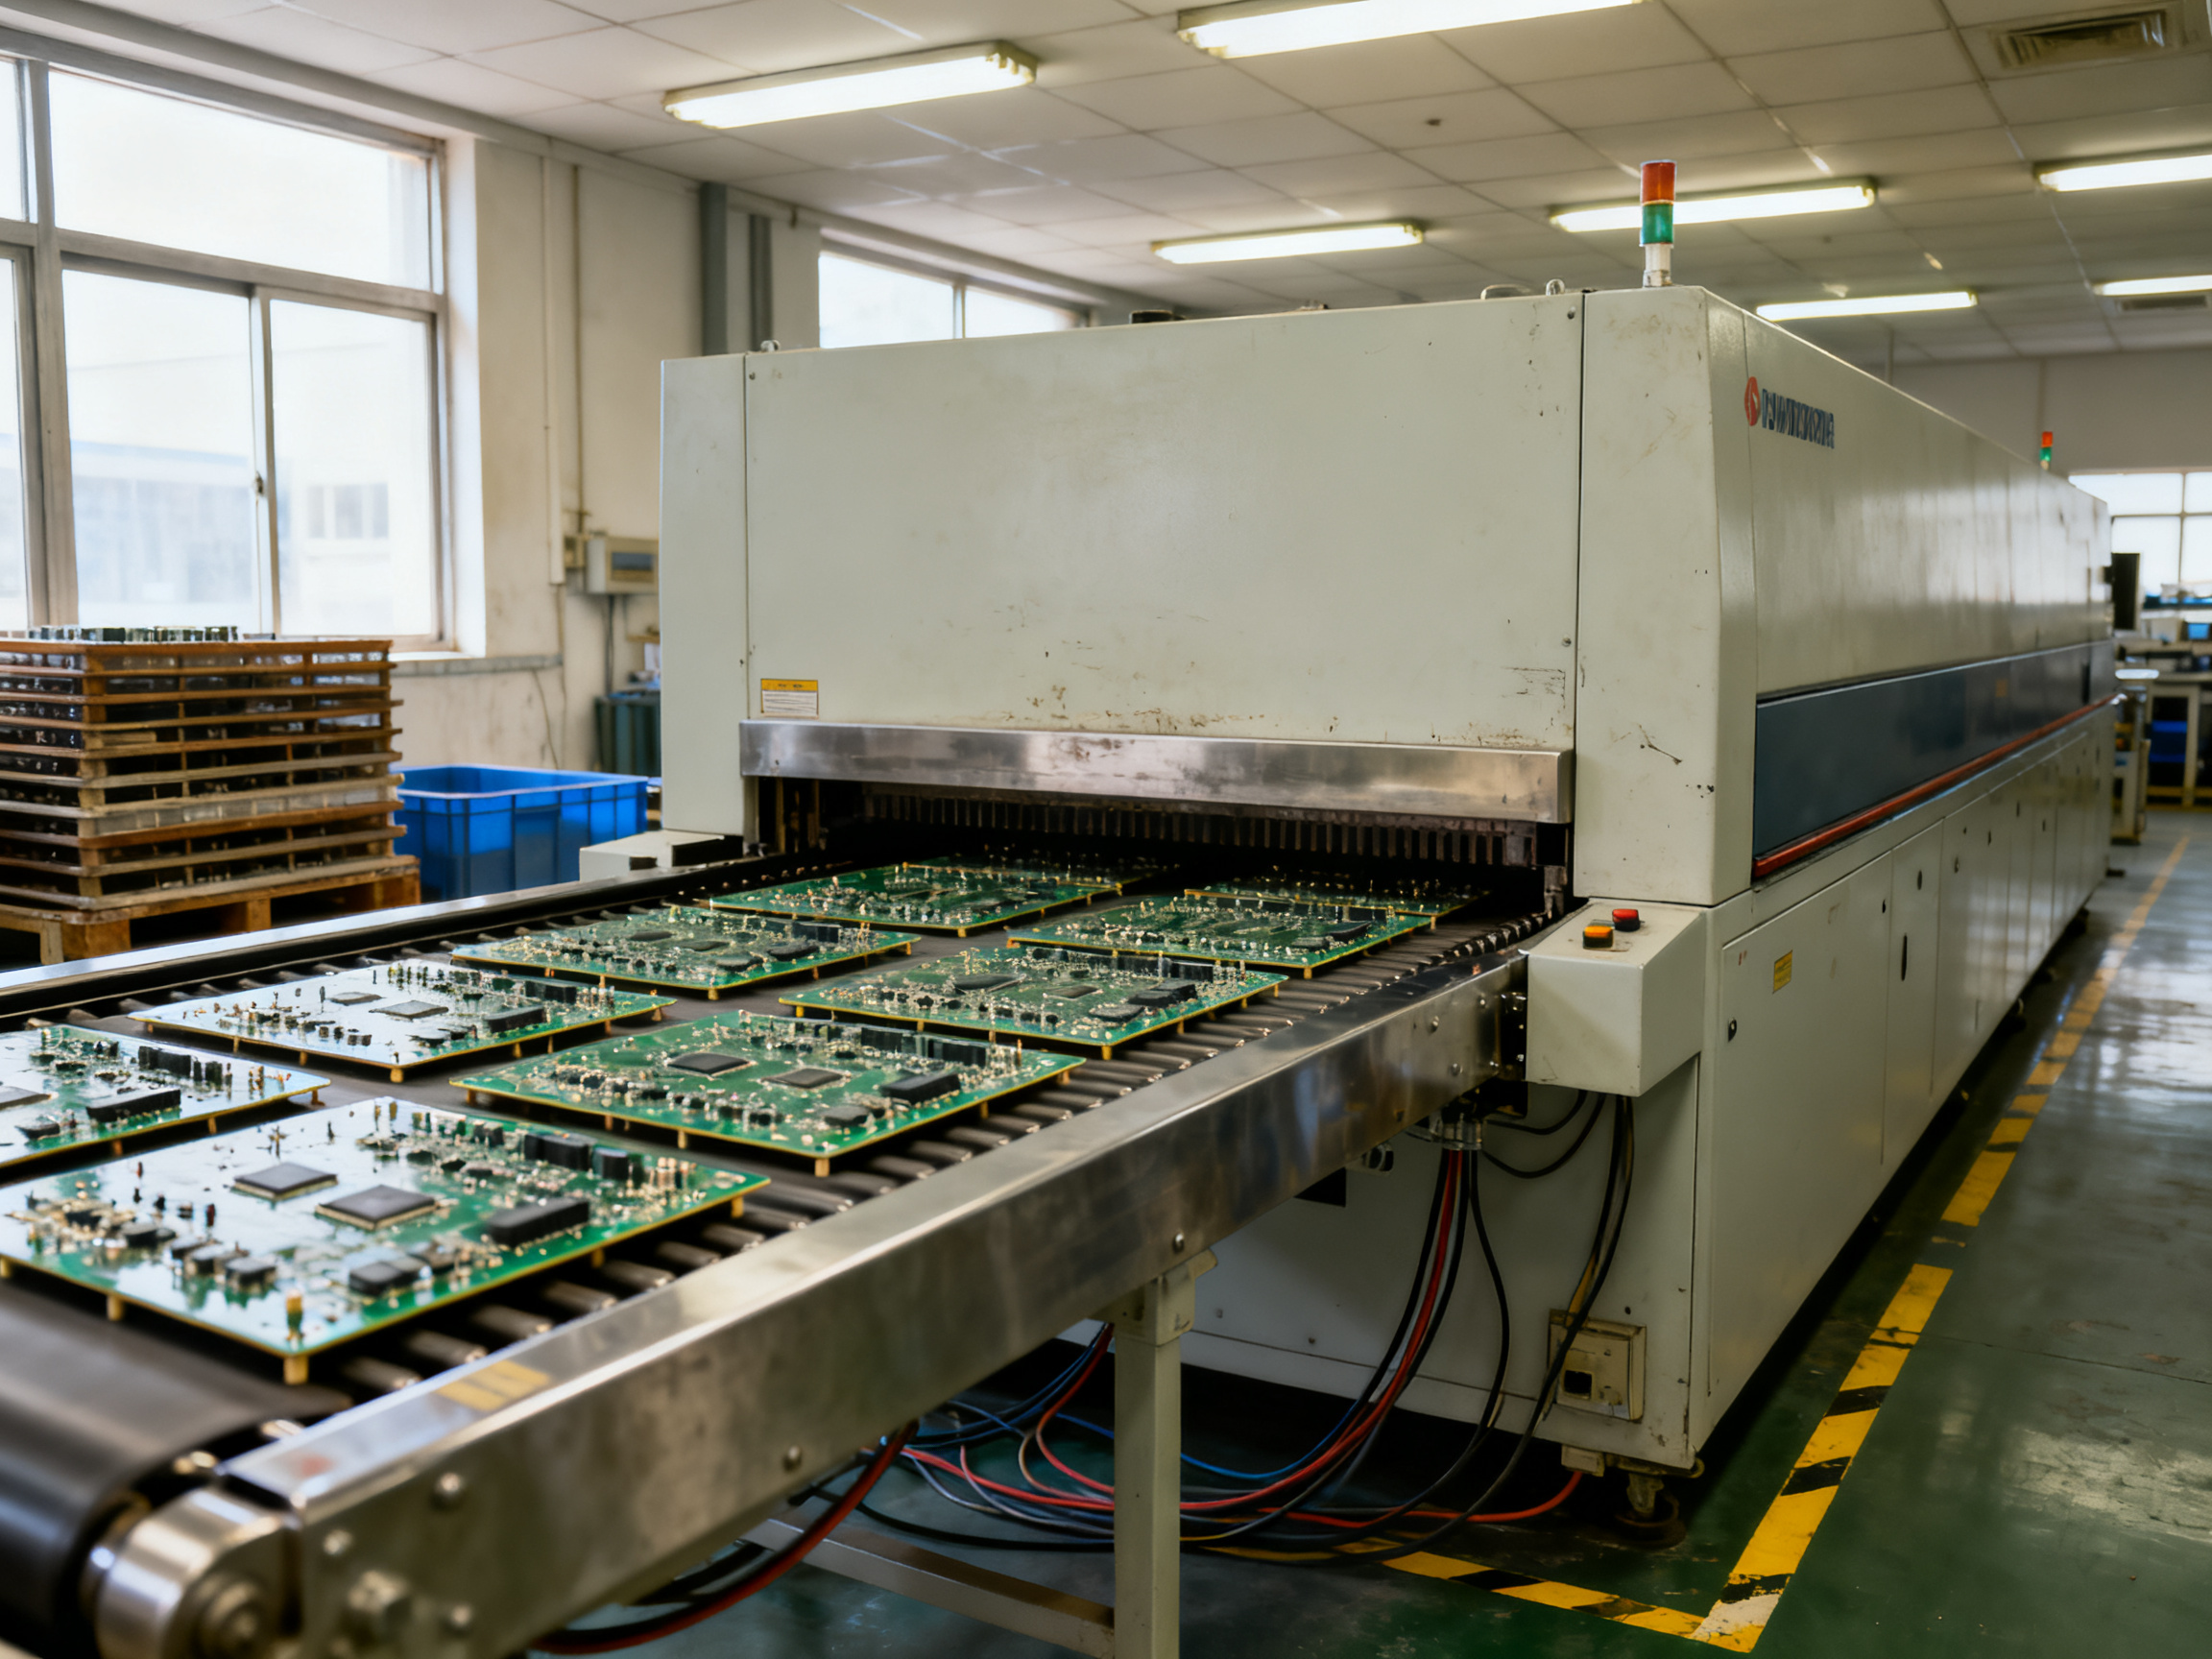
That is the core idea in this guide. PCB warpage is not a material defect and it is not a component defect. It is a thermal history defect. The board goes in flat and comes out bent because of the way heat moved through its layers during those five or six minutes. The stackup, the copper distribution, the finish, the components, those all set the conditions. But the reflow oven temperature profile is what actually applies the load, and for most of the warpage you see in production, the bending is decided before the board ever leaves the oven.
So why does this matter so much for volume? Because at smartphone, semiconductor, and military production rates, warpage is not a quality metric sitting in a report. It is a cost line and a delivery risk. Tighten the flatness limit and you change placement accuracy, change first-pass yield at final test, change how much rework and scrap you pay for at the end of the shift. A fraction of a millimeter is the difference between a board that goes through four downstream steps cleanly and one that gets flagged at test.
What this guide gives you
A repeatable method to build, measure, and validate a reflow oven temperature profile that holds board flatness at line speed. You will get a plain-language reflow profile explanation of what each zone is doing, what the ramp rate and soak time actually change, how to attach thermocouples so the measurement means something, and how to keep the profile locked in place once it works.
We also want to be straight about the limits. A temperature profile cannot rescue asymmetric copper, a laminate with the wrong flexural properties, undersized pads, or a heavy component hanging off one edge. No reflow oven profile calculator will give you that back. What a good profile does is remove the thermal variable you control, so when a board still bows, you can look honestly at the design.
One more note before we start. Every window and number in this guide traces back to a paste technical data sheet, a component supplier’s thermal limits, or a controlled profile report from a customer specification. Where an industry figure appears, we tell you where it came from. And check the current revision of any standard we name against the official IPC and JEDEC catalogs before you build a spec around it; those documents get updated, and a profile written against a stale revision is a profile nobody can defend in an audit.
Author note: This article is written by an SMT process engineer at Shenzhen Chuxin Electronic Equipment Co. Ltd. (S&M Co. Ltd.), working with lead-free reflow ovens and wave soldering systems for high-density, high-volume assemblies in consumer electronics, semiconductor, and military production. The examples come from hands-on reflow profile validation work, including thermal profiling on multi-layer and BGA/QFN boards and tuning ramp rates and soak times to control warpage. Reviewer: [REVIEWER NAME], [REVIEWER CREDENTIALS]. Both the author name and the reviewer credentials are placeholders that S&M’s marketing team fills with named personnel and certificate numbers before this article goes live.
Hero image suggestion: annotated cross-section of a multi-layer PCB showing copper distribution and where thermal stress concentrates.
About the Author
This article is written by an SMT Process Engineer at Shenzhen Chuxin Electronic Equipment Co., Ltd. (S&M Co. Ltd.), [AUTHOR NAME], [CREDENTIALS / CERTIFICATE NUMBERS TO BE CONFIRMED BY S&M MARKETING BEFORE PUBLICATION].
The work behind these sections runs on lead-free reflow ovens and wave soldering systems supporting high-density, high-volume lines for consumer electronics, semiconductor packaging, and military-grade assembly. Most of it happens at the profile bench rather than on a conference slide: thermocouples on multi-layer and BGA/QFN boards, ramp rates re-tuned until a warped panel came out flat, soak windows checked against the paste technical data sheet instead of a generic chart.
That is the experience this guide draws on. Not theory, and not a numbers set copied from a forum post.
Reviewer: [REVIEWER NAME], [REVIEWER CREDENTIALS, e.g. IPC-A-610 Certified Specialist or Lead-Free/RoHS Process Audit certification], S&M Co. Ltd.
Editor note for S&M marketing: replace all bracketed placeholders with named personnel, verified certificates, and credential numbers before this article goes live. The experience claims should be backed by internal controlled profile records.
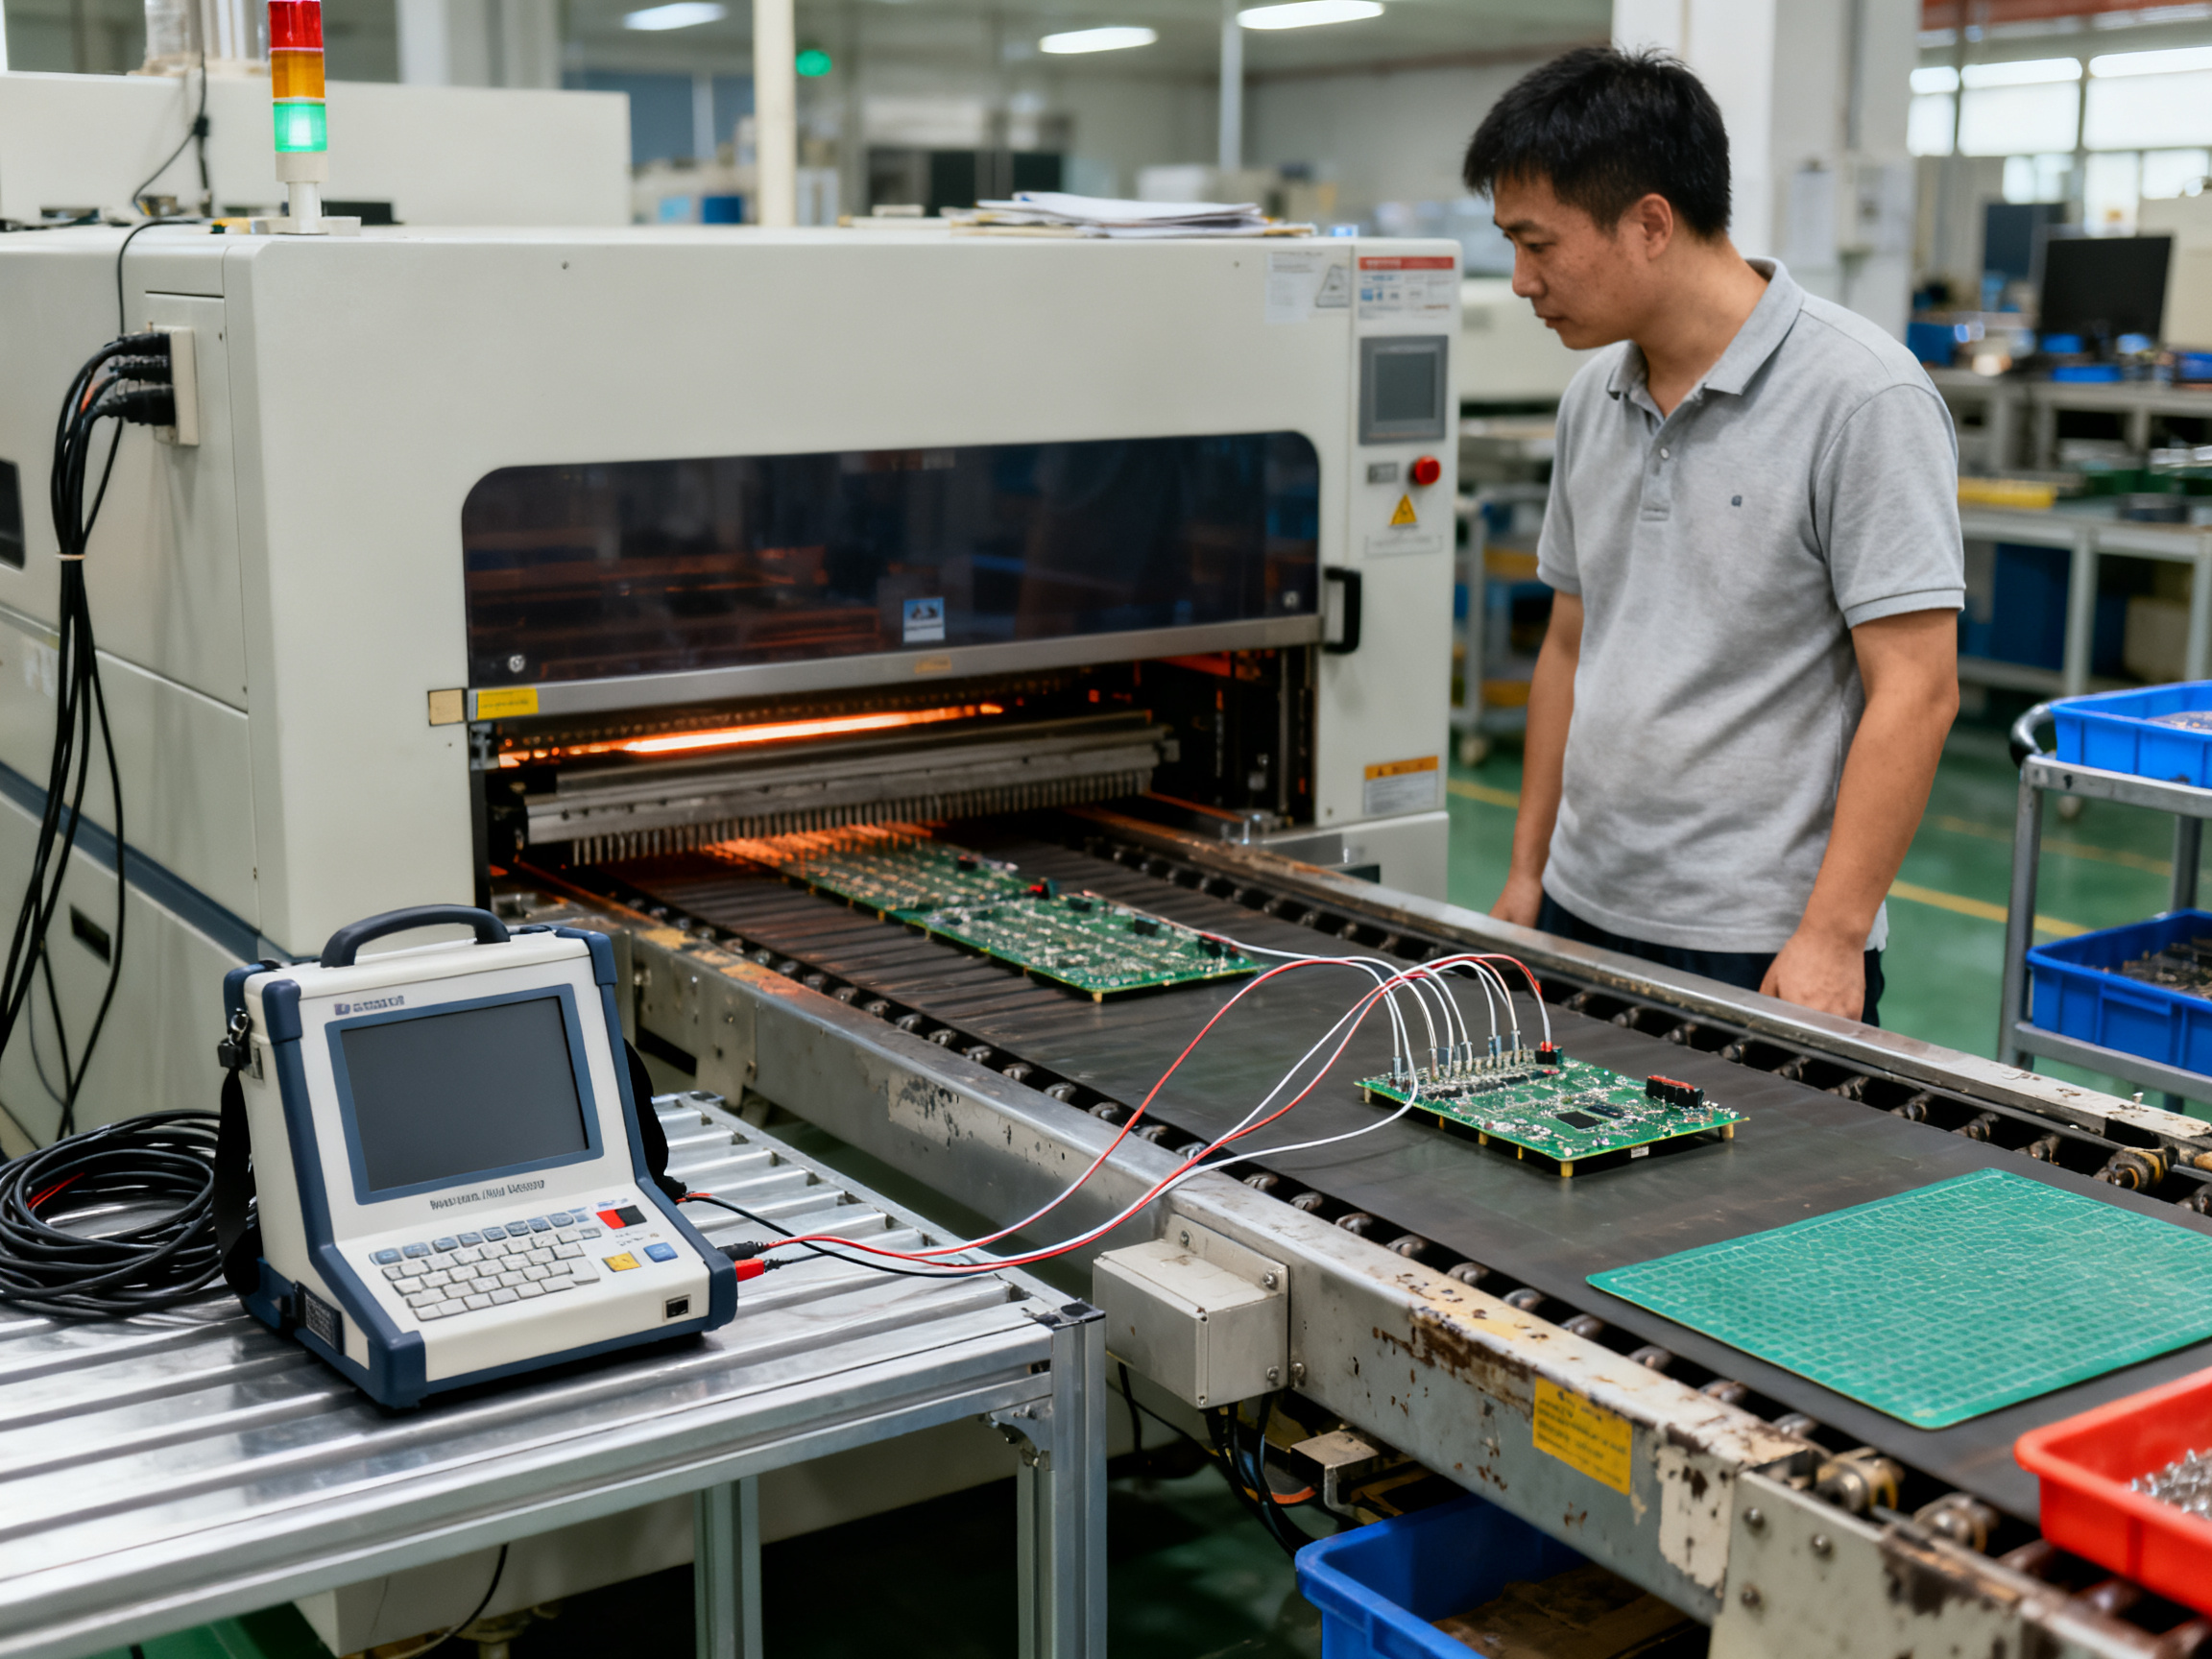
Small equipment shot: the profile bench with the reflow oven in the background, thermocouples clipped to a test coupon, and the profiler screen showing live traces. A tight shot of hands attaching a Type-K junction works better than a wide empty factory floor here.
A note on sourcing: the hands-on details in this guide come from S&M internal profiling work, so treat the specific numbers as starting points for your own line. When you validate against a paste data sheet, a component supplier’s thermal limits, or your customer’s controlled specification, write those references into the profile record. That record is what protects you in an audit, and it is also what tells the next engineer why the profile looks the way it does.## Section 2: How to Measure a Reflow Oven Temperature Profile
A useful reflow profile is not something you calculate once and paste into an oven recipe. It is something you measure on a board that represents the real production load. The measurement records the board’s actual temperature over time, revealing whether the assembly experienced the ramp rate, soak, peak temperature, and time above liquidus that the solder paste and components require.
The process is commonly called profiling, and it requires a profiler, thermocouples, a representative test board, and enough time to run the board through the oven under realistic conditions.
What you need
A practical profiling setup includes:
- A thermal profiler capable of recording temperature over time
- Fine-wire thermocouples suitable for PCB profiling
- High-temperature-resistant attachment material, such as Kapton tape
- A representative PCB with the same construction, copper coverage, and component loading as production
- The solder paste, paste stencil, and assembly process used in production
- A way to verify the final board flatness
Do not profile an empty PCB when production boards are heavily populated. Components alter heat capacity, block airflow, create hot spots, and may shield solder joints from the surrounding thermal environment. Conversely, a bare test coupon can heat faster than a loaded assembly and produce an optimistic profile.
Pro Insight: Profile the assembly you intend to build. If your production line mixes several board families, each significantly different construction should receive its own profile or be assigned to a validated process group.
Where to place the thermocouples
Thermocouple placement determines whether the recorded curve represents the actual risk areas on the board. Position the measurement points where thermal behavior and solder-joint quality are most likely to differ.
For a typical rigid PCB, begin with these locations:
- A heavy thermal-mass area. Place a thermocouple near a large copper pour, ground plane, connector, or densely populated section. This location helps expose slow heating and can reveal excessive lag behind the oven setpoints.
- A light or thermally isolated area. Place another near a small component, narrow trace, or edge region with less copper. Light areas may heat faster and reach a higher peak temperature than the rest of the board.
- A central solder-joint area. Position a thermocouple at or immediately beside a representative fine-pitch component. Fine-pitch joints are sensitive to insufficient heating and inadequate time above liquidus.
- A heated-board or return-flux area. On lead-free processes, this zone may receive additional heat to remove residual solvents. Place a thermocouple here when the component package and PCB construction make this location particularly sensitive.
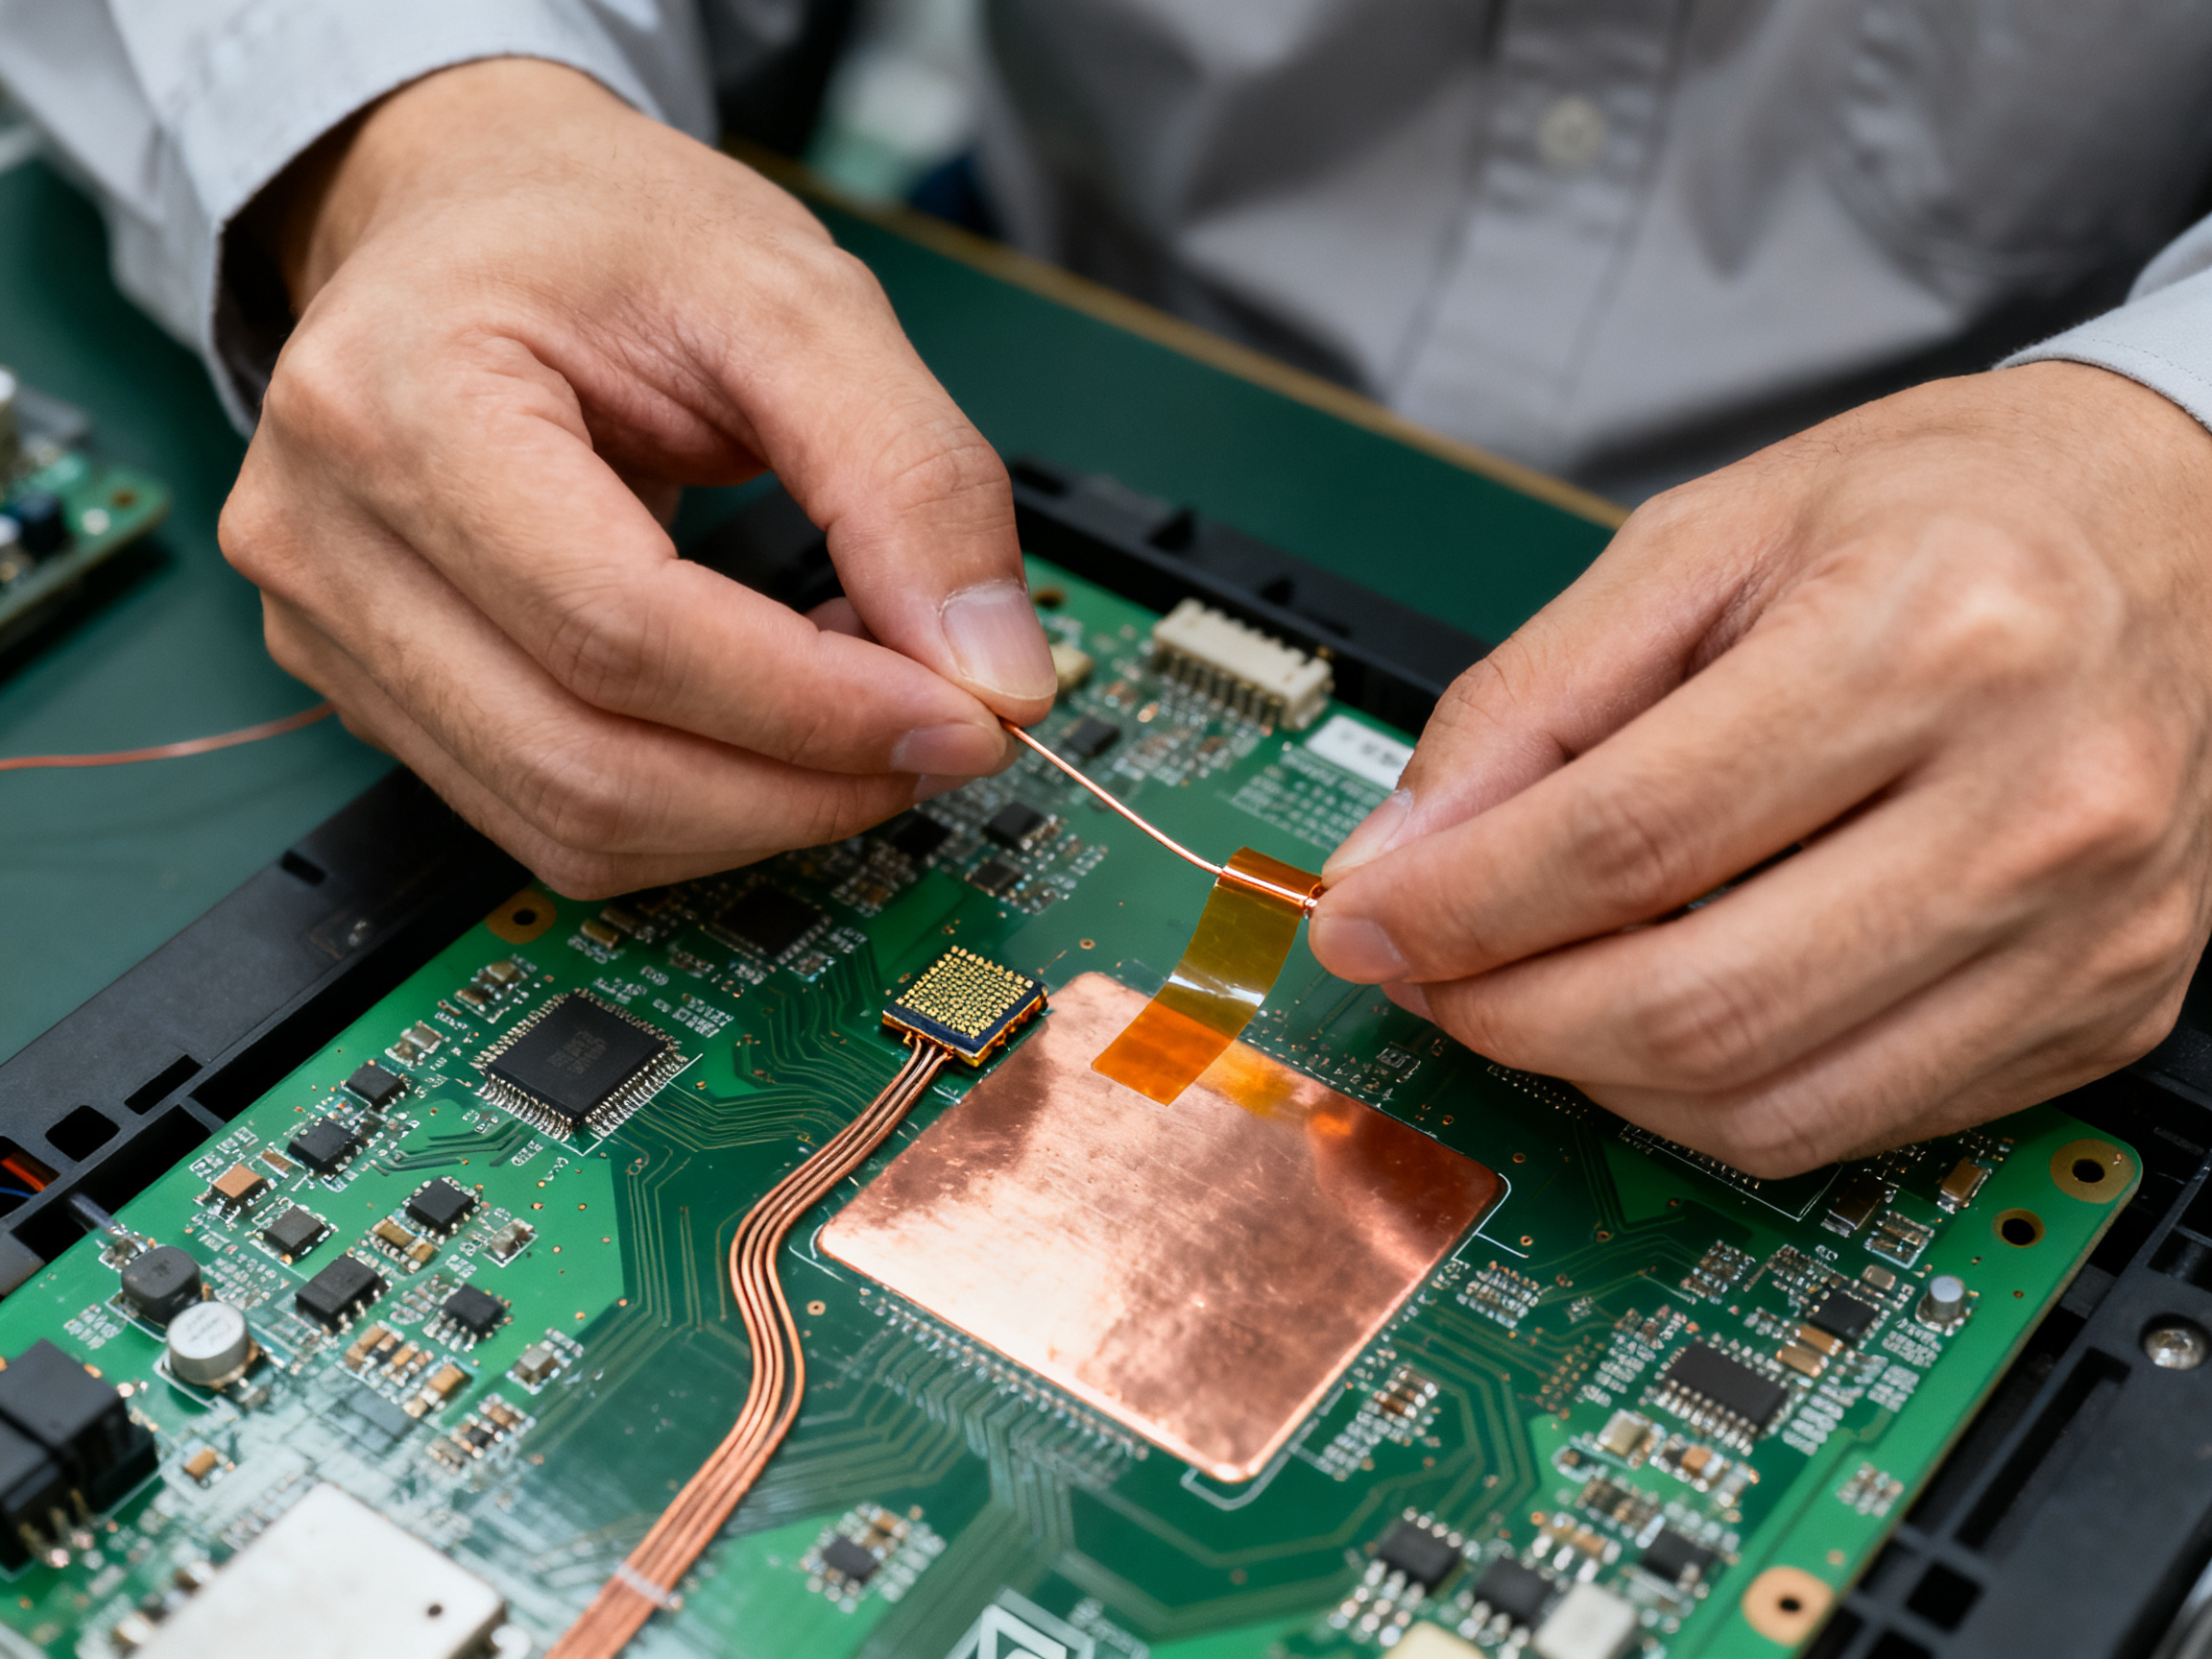
A common layout is to place thermocouples on a separate prepared test board at the same coordinates used for real component inspection. For accurate readings, the thermocouple junction must make intimate contact with the surface being measured. Secure it with a small piece of Kapton tape, route the fine wire along the board where practical, and minimize the amount of exposed wire.
The thermocouple should be attached before the board enters the oven. It should not be attached to a component that could shift during handling. Avoid large adhesive masses, because they can insulate the junction from the board or introduce their own thermal delay.
How many boards should you profile?
The answer is not a fixed number of thermocouples. It is a question of how many materially different thermal zones exist on the assembly.
Use enough probes to compare:
- The lightest and heaviest areas of the PCB
- The board center and edge
- Thermally isolated components and components adjacent to large copper areas
- Dense and sparse component regions
- Any construction or component package that creates a known hot spot
For a relatively uniform, small board, two well-placed thermocouples may be sufficient during early development: one on a heavy area and one on a light area. A large, multilayered, or densely populated assembly usually needs more. A typical starting point is three or four locations, but the correct quantity is determined by the board’s construction and acceptable temperature window.
The number of boards run in a lot is a separate decision. Run the oven with the same number of boards, spacing, orientation, and loading used in production. Place the instrumented board at a position that represents the expected range within the oven, including the beginning, middle, or end of the load when those positions behave differently.
If the oven is heavily loaded, check both a full oven and the first board through an empty or lightly loaded oven. This comparison can reveal airflow restrictions and load-dependent temperature variation. An empty-oven result is useful for commissioning, but it is not a substitute for a production-load profile.
Running the test
Before recording data, prepare the board exactly as production would:
- Print the paste and place all components, or prepare the board with equivalent thermal mass and loading.
- Attach the thermocouples without displacing components or changing the local airflow more than necessary.
- Set the oven recipe to the initial candidate profile.
- Set the conveyor speed to the intended production speed.
- Load the oven at the intended density.
- Start the profiler before the board enters the heated section.
- Run the board completely through the heating, reflow, and cooling sequence.
- Save the raw temperature data and the oven settings.
After the run, inspect the board for wetting, solder-ball formation, insufficient melting, discoloration, tombstoning, bridging, and other visible defects. Also check flatness with a suitable gauge. A profile can look acceptable while still producing unacceptable assemblies if the measured location does not represent the actual component population.
How to analyze the recorded curve
Review the complete board-temperature trace rather than only the peak. Identify the heating ramp, soak region, peak, time above liquidus, and cooling behavior.
Compare those results with the paste manufacturer’s published process window and the component supplier’s soldering recommendations. The paste data sheet is the primary source for alloy-specific guidance, including recommended ramp rate, soak temperature and time, peak temperature, and time above liquidus.
If the board exceeds a limit, adjust the oven recipe and repeat the test. Changes to zone setpoints affect the heating path, while changes to conveyor speed affect the time the assembly spends in each zone. Small setpoint adjustments and modest conveyor-speed changes can produce very different board temperatures, so make one controlled change at a time whenever possible.
Do not use the profiler’s maximum reading as the peak temperature without understanding where and when it occurred. An isolated hot spot may indicate a component-level risk, while a broad, stable peak across multiple probes suggests a more uniform process.
A practical acceptance checklist
Before releasing the recipe for production, verify that:
- Every measured board location remains within the paste supplier’s process window.
- The assembly reaches the required peak temperature with adequate margin below component and board limits.
- Time above liquidus meets the paste requirements at the measured critical locations.
- The soak is sufficient for flux activation without excessive baking.
- No thermal hot spots exceed approved package or material limits.
- Solder joints show acceptable wetting and fillet formation.
- Board flatness remains within specification.
- The profile is repeatable across the oven’s loaded positions.
- The profile record identifies the board revision, paste lot or type, oven, recipe, conveyor speed, load pattern, thermocouple positions, and operator.
The profile is not complete merely because the chart looks like a textbook curve. It is complete when the measured temperatures, inspected joints, and measured board flatness all support a repeatable production process.
[Image suggestion: annotated PCB showing thermocouple placement on a heavy copper region, a light component area, a fine-pitch joint, and a thermally sensitive component.]
[Image suggestion: side-by-side example of a profile captured on an empty oven and the same profile captured under full production load.]
What to take into Section 3: profiling turns oven setpoints into a measured board-temperature history. The next section covers how to build a practical process window, calculate time above liquidus correctly, and turn a successful trial profile into a controlled production specification.## Section 2: The Four Zones of a Reflow Oven Temperature Profile
Before we talk about warpage, we have to talk about what the oven is actually doing to the board. A reflow oven is a controlled heat source, and the temperature profile is the story of how that heat enters the assembly, sits in it, peaks in it, and then leaves it.
Here is the short version of how a reflow oven works: forced convection moves hot air across a conveyorized board, and each heated zone adds or removes a specific amount of thermal energy. The board absorbs that energy, its solder paste melts, and then the board cools. That cycle happens in roughly five to seven minutes, and every fraction of a degree inside it matters more than most people expect.
A typical reflow temperature profile breaks into four jobs, and each one has a specific thermal purpose. When you understand the job, the numbers stop being arbitrary setpoints you copy from somebody else’s recipe.
Zone 1: Preheat and soak, roughly 150 to 200°C
This is the longest and most quietly important zone. Its job is to bring the whole board up to a uniform temperature and to activate the flux.
Uniform is the key word. During preheat, a heavy copper ground plane, a large connector, and a small 0402 resistor do not heat at the same rate. The copper areas lag. The small parts run ahead. That difference is a thermal gradient running across the board, and a gradient is what bends a board.
The soak holds the assembly inside a temperature band long enough for the flux to do its job and for the temperature difference between heavy and light areas to shrink. In practice, this means soaking somewhere around 150 to 200°C for SAC305 lead-free paste, often between 60 and 180 seconds. Legacy Sn63Pb37 processes soak lower, commonly in the 100 to 150°C range, because the eutectic solder melts so much earlier.
This zone is your first and best lever on warpage. A soak that is too short leaves thermal gradients unresolved. A soak that is too long bakes the paste, drives off too much flux, and can dry out the solder print before it even reaches the melt point.
Zone 2: Ramp to peak
Now the oven brings the assembly up toward the alloy’s liquidus and past it. SAC305 goes liquidus at about 217°C. Sn63Pb37 goes liquidus at 183°C. High-temperature lead-free alloys with silver sit in the same general 215 to 220°C liquidus region, but their working peak is much higher.
During this ramp, the board temperature must climb at a controlled rate. Common practice is 1 to 3°C per second, with about 4°C per second treated as a practical ceiling for most modern lead-free work.
The reason the ramp matters for warpage is timing. If the top side of the board reaches 230°C while the bottom side is still at 180°C, the two sides want to expand by different amounts at the same moment. That mismatch through the board thickness is the bending force. Every degree per second you add to the ramp makes it harder for the board to relax into a flat state before the solder locks everything in place.
Zone 3: Liquidus and peak, the reflow zone
This is where the solder actually melts and wets. Typical peaks run 235 to 245°C for SAC305, 215 to 225°C for Sn63Pb37, and 245 to 260°C for high-temperature lead-free alloys such as silver-bearing SAC405.
Peaks are not a “set it as high as possible” decision. The peak has to clear the alloy liquidus with enough margin to wet a good fillet, but it also has to stay under the component’s maximum body temperature rating. Most modern components are rated to 260°C, which gives you room, but not unlimited room, and some packages, connectors, and polymer-sensitive parts have lower limits.
Time above liquidus is the other half of this zone. SAC305 processes usually run 30 to 90 seconds above liquidus. The right number is the one the paste technical data sheet gives you, because a paste with a different flux chemistry needs a different window.
Zone 4: Controlled cooling
Cooling gets less attention than it deserves. The joints are still molten when the board leaves the peak, so the rate at which you pull heat out decides how the microstructure freezes.
Standard practice is 1 to 4°C per second for the controlled cooling ramp. Too fast and you get thermal shock through the board. Too slow and the board stays hot and pliable longer, which sounds good for flatness, but risks joint distortion and can leave the assembly in a worse mechanical state.
For warpage specifically, the cooling zone is where locked-in stress is set. The gradient that survives to the end of the reflow zone becomes a permanent bow once everything solidifies.
A side-by-side comparison
The table below orients you across the three alloy families you are most likely to meet. Treat it as a starting point for orientation, not as a spec. Your paste data sheet and your component supplier’s limits win every time.
| Parameter | SAC305 (standard lead-free) | Sn63Pb37 (legacy) | High-temp lead-free (Ag-bearing) |
|—|—|—|—|
| Liquidus | ~217°C | ~183°C | ~215 to 220°C |
| Preheat / soak target | 150 to 200°C | 100 to 150°C | 150 to 220°C |
| Soak duration | 60 to 180 s | 60 to 120 s | 60 to 180 s |
| Ramp rate | 1 to 3°C/s, ~4°C/s max | 1 to 3°C/s | 1 to 3°C/s, ~4°C/s max |
| Peak temperature | 235 to 245°C | 215 to 225°C | 245 to 260°C |
| Time above liquidus | 30 to 90 s | 30 to 90 s | 30 to 90 s |
| Cooling approach | Controlled ramp, 1 to 4°C/s | Forced chill, often faster | Controlled ramp, 1 to 4°C/s |
| Component body limit check | Required (commonly 260°C) | Required | Critical (peak near limit) |
| Warpage sensitivity to soak | High | Moderate | High |
Where warpage enters each zone
Pull that table apart and a pattern shows up. The preheat zone sets the initial thermal gradient, so soak adequacy is your first line of defense against warpage. The ramp zone multiplies that gradient if it is too fast. The reflow zone determines how much time the board has to relax. And the cooling zone decides whether whatever gradient remains gets locked into the laminate as permanent bow.
Pro Insight: When you set a zone recipe, ask one question per zone. What job does this zone do, and which board property does that job protect? If a zone has no clear answer, it may be doing more harm than good.
The legacy to lead-free shift changes more than temperature
If you are moving a line from Sn63Pb37 to SAC305, the zones shift, but so do several other things. Lead-free pastes have a narrower operating window and often need more aggressive flux activation. Silver-bearing high-temperature alloys demand higher peaks, which pushes you closer to component limits. Solder balling and bridging behavior changes. And if you have old equipment still set up around a 225°C world, the oven itself, not just the recipe, may need attention.
This is where an oven’s own documentation becomes useful. The reflow oven manual tells you what the zone setpoints actually mean in your machine and how the airflow is arranged, and a proper reflow oven validation checks those setpoints against measured board temperatures rather than trusting the panel.
One practical note on tooling. Plenty of teams start with a reflow oven profile calculator or a reflow oven temperature profile PDF from a supplier. Those are fine for orientation, but a generic chart cannot know your board’s copper distribution, your component mass, or your oven’s airflow. Profile the real assembly.
What to take into the next section: zones and alloys give you the vocabulary. Next we look at the parameter that moves warpage the most: ramp rate control, and how to read a real thermal trace to see the gradient that bends the board.
Table image suggestion: four-stage reflow curve for SAC305 with soak, ramp, peak, and cooling annotated, with the equivalent Sn63Pb37 and high-temperature lead-free curves overlaid.
[Image suggestion: side-by-side photo of a lead-free board and a legacy board after reflow, showing flatness difference on a granite surface.]## Section 3: PCB Warpage Mechanics, How Thermal Stress Bends a Board
Before you can control warpage with a temperature profile, you need to know what is actually bending the board. And the answer is rarely “bad material.” It is usually a mechanical imbalance that the oven’s heat cycle exposes.
Here is the short version. A printed circuit board is a sandwich: copper foil, fiberglass resin, more copper foil, solder mask on top. Those layers do not all want to expand by the same amount when they get hot. Copper expands far less than the resin and glass in the laminate. So the stack behaves like a bimetal strip, and it bends.
The bending happens in two stages. First, during ramp-up, the board heats unevenly and develops a bending moment. Second, during cooling and solidification, whatever shape it holds gets locked in.
The three contributors you can actually control
1. CTE mismatch between layers
The coefficient of thermal expansion (CTE) is the number that describes how much a material grows per degree of temperature change. Copper sits around 17 to 18 ppm per degree. Common FR-4 laminate is closer to 14 to 18 ppm in-plane, and considerably higher through the thickness (z-axis), often in the 50 to 80 ppm range. Solder mask sits somewhere in between. That is a mismatch, and mismatch means bending.
2. Asymmetric copper distribution
This is the big one, and it is a design characteristic more than a process one. When a board has dense copper on the bottom side and a nearly bare top side, the two sides want to expand at different rates. That imbalance acts like a hinge.
Think of a stack where the bottom layer carries a heavy ground plane and the top layer carries a light signal layer. The bottom side expands less. The laminate bows with the copper-heavy side on the inside of the curve. Reverse the imbalance, reverse the bow.
The neutral axis, the plane in a bent board where nothing stretches or compresses, shifts toward whichever side carries more material. The further it shifts from the geometric center of the board, the more leverage the thermal force has. In practice, a top-heavy or bottom-heavy stackup on a thin board can bend more than a badly matched CTE on a thick, symmetric board.
3. Package attach and board thickness
A large BGA on one side adds mass and heat capacity exactly where you do not want it. So does a heavy connector. A 1.6 mm board with a dense BGA on one side is a lever. A 2.5 mm board with a modest part count barely moves.
Why laminate Tg matters, and where it stops mattering
Glass transition temperature (Tg) is often described as the temperature at which the resin softens and the laminate loses rigidity. Boards with a low Tg, commonly in the 130 to 150°C region, soften well before the solder reaches liquidus. That sounds bad on paper, and for extreme cases it is.
But Tg is not a universal warpage predictor, and you should be careful with anyone who tells you it is. What actually matters is whether the board passes through its softening region with a significant temperature gradient across its surface. A low-Tg board profiled with a long, gentle soak and a controlled ramp can come out flatter than a high-Tg board rammed through a fast ramp, because the soak gives the gradient time to equalize before the material gets soft.
Here is the practical rule: high-Tg laminate (commonly 170 to 180°C and above) buys you margin, especially for multilayer boards and high-temperature alloys. But it does not rescue an asymmetric stackup or a badly controlled ramp.
What a fraction of a millimeter costs you
Now the part that gets a board flagged. Warpage shows up as three separate things at three separate stations.
Placement. A bowed board sits at a slightly different angle in the placement machine. The placement head reaches a little further, and the nozzle may not seat squarely on a large package. It shows up later as a cold joint or a lifted corner, not as a placement error, which is exactly why this defect gets misdiagnosed.
Solder joints. BGA and QFN joints on a bowed board see shear and peel as the package tries to pull itself flat. During subsequent thermal cycling, that stress concentrates at the corner joints and opens a crack. The classic symptom is an intermittent open that passes test at room temperature and fails at temperature.
Vias. Cracked via stacks are common on the same bent board. Through vias in multilayer constructions carry plated barrels whose CTE does not match the laminate. A board already under bending stress adds a second load on top of the existing mismatch.
What the numbers actually mean
You will see warpage limits quoted all over the place. Some are bare-board limits from laminate suppliers, some are assembly-level limits in customer specs, and some are package-level coplanarity numbers that have nothing to do with your board. Do not mix them.
Many assembly shops work to limits in the 75 to 100 µm range on finished boards, and some customers specify warpage as a percentage of board diagonal, often around 0.75%. Treat these as starting points for discussion, not as universal IPC limits. The authoritative number for your line comes from three places, in this order: your customer specification, the component supplier’s requirement, and your own laminate supplier’s bare-board data.
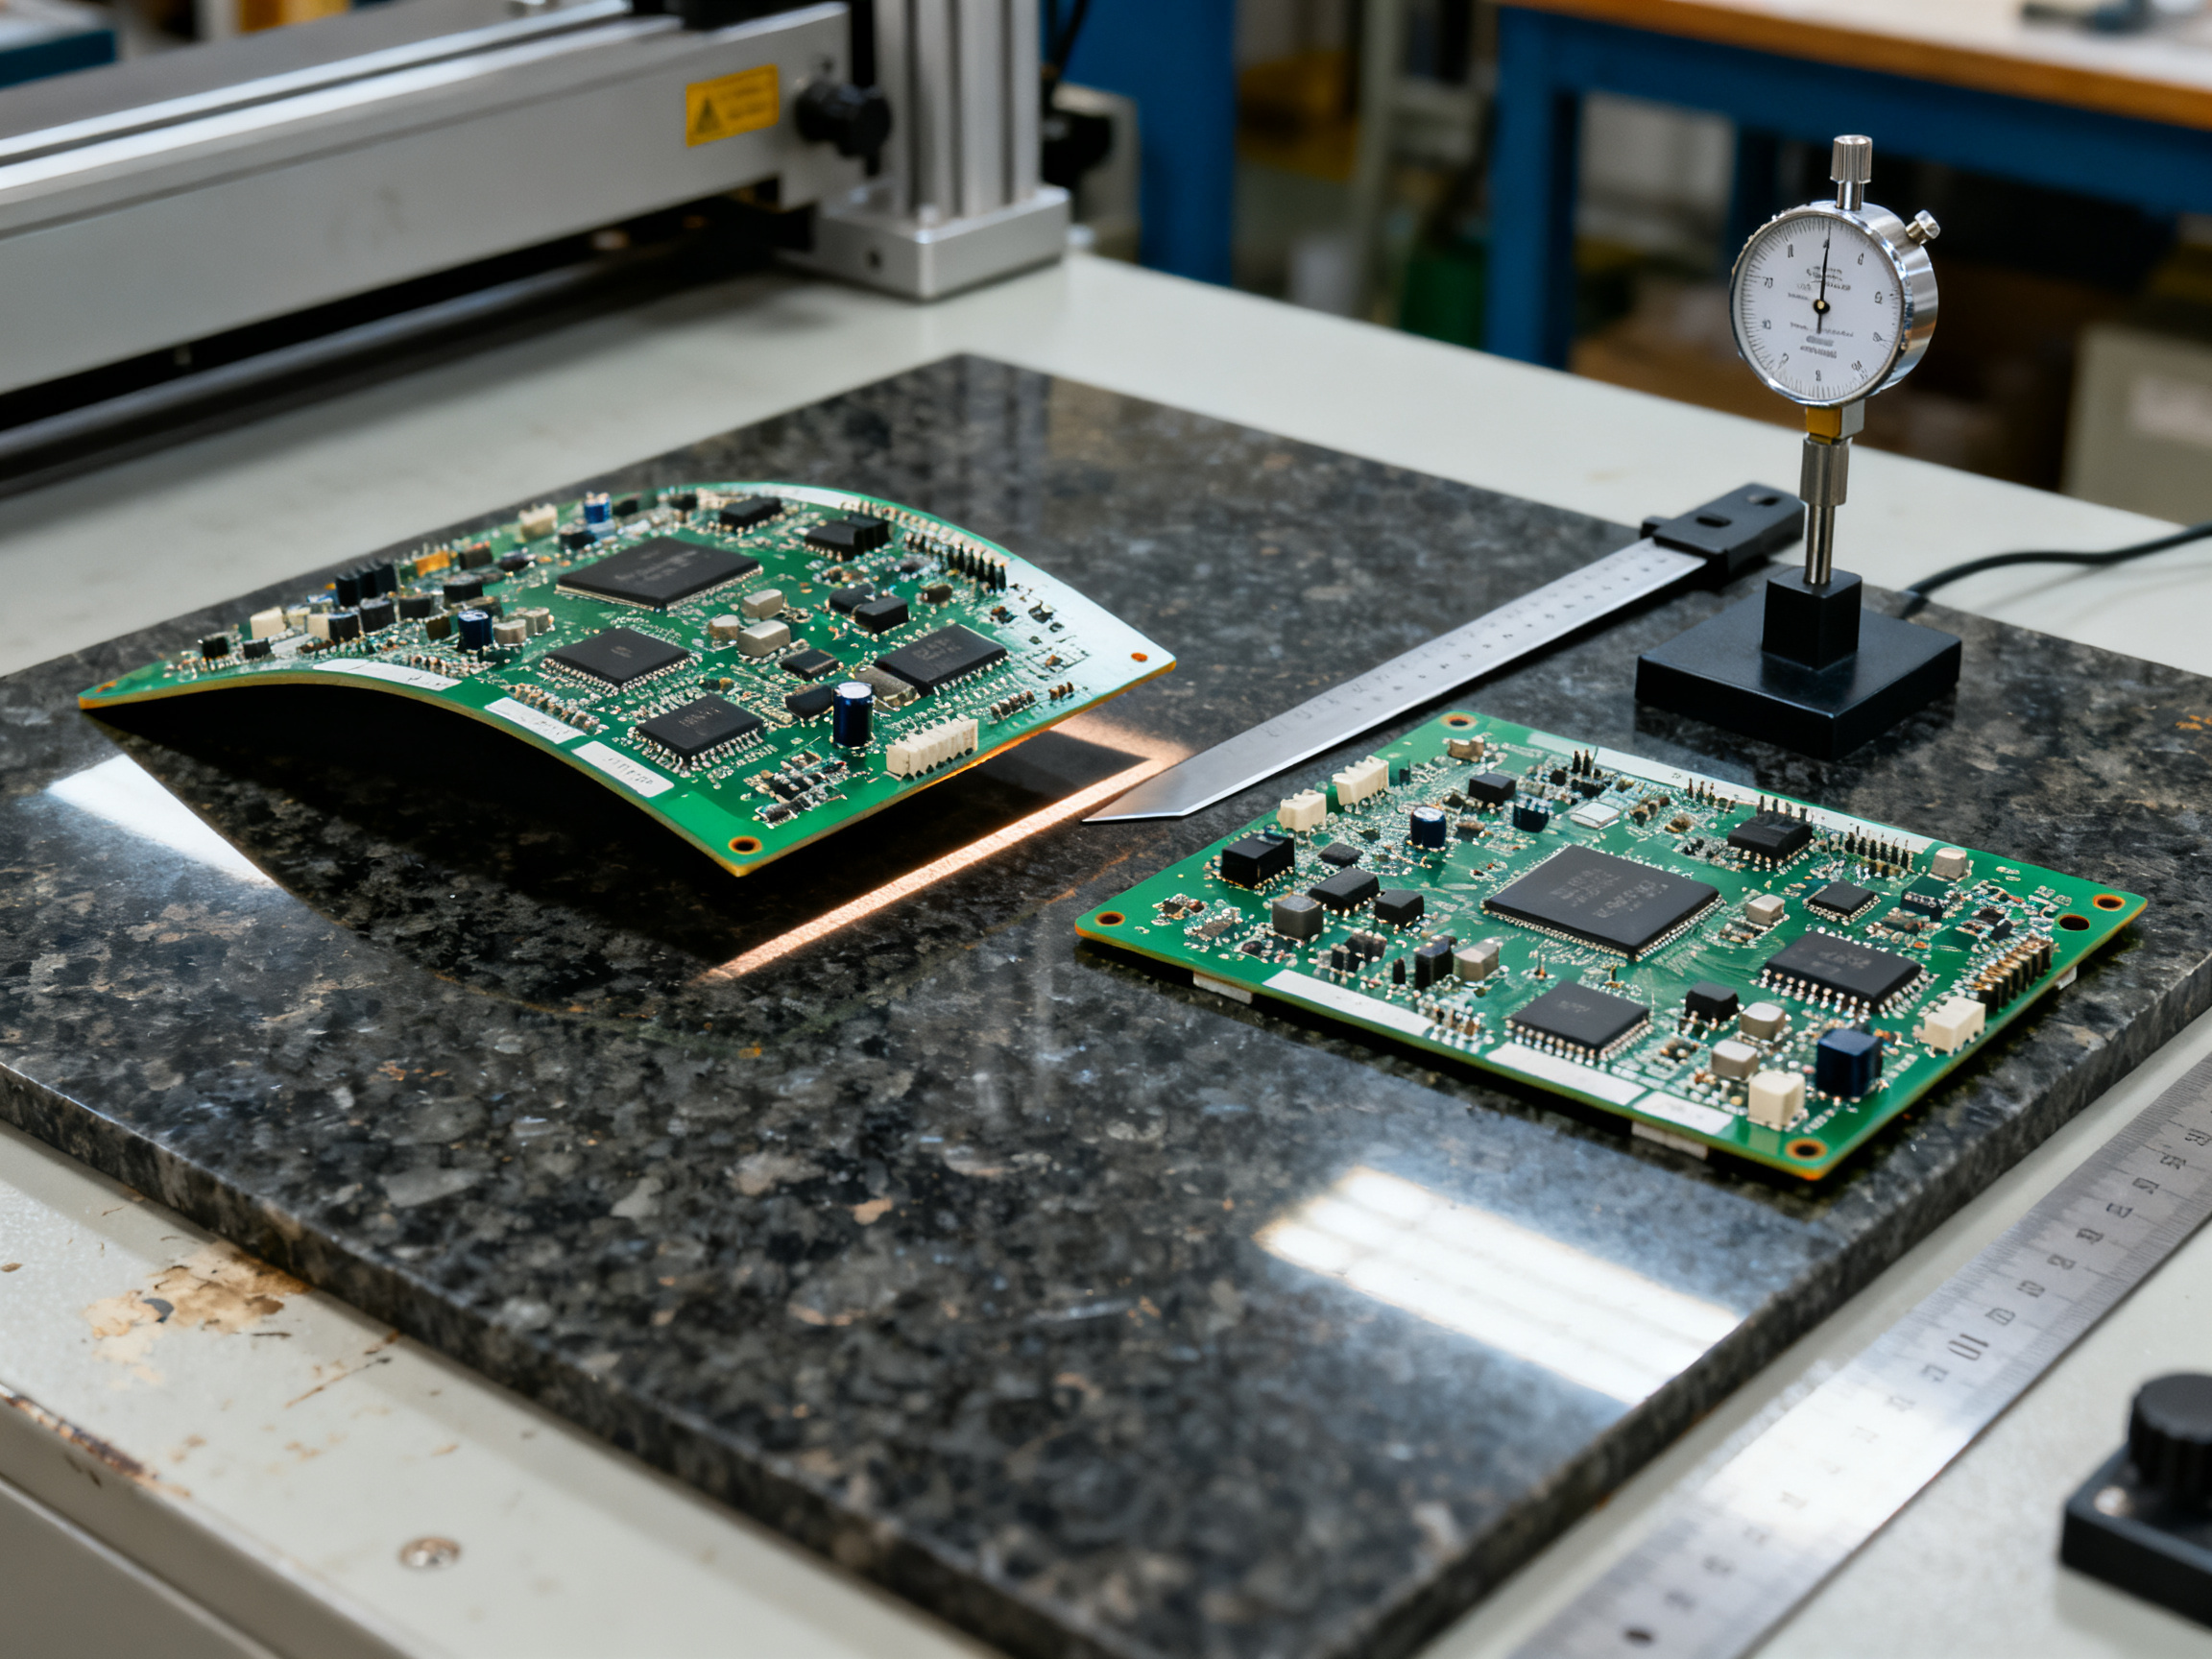
Then verify how that limit is meant to be measured, because that changes everything. A bare-board bow measured on a granite surface with a straightedge is not the same measurement as a fully assembled board sitting on a fixture. And component package warpage measured at temperature is a completely different quantity from room-temperature board bow. Conflating the three is the most common reason two engineers look at the same board and argue about whether it passes.
| Contributor | Typical range | Effect on warpage | Can a profile fix it? |
|—|—|—|—|
| Z-axis CTE (laminate) | 50 to 80 ppm/°C | High. Adds out-of-plane bending | Partly, via soak and ramp |
| Copper asymmetry | Wide, design driven | Often the dominant driver | No, only reduces amplification |
| Board thickness | 0.8 to 2.5 mm common | Thicker boards resist bending | No |
| Package mass on one side | BGA, connectors | Adds moment and heat capacity | Partly, via soak and peak control |
| Laminate Tg | 130 to 180°C+ | Low Tg softens early, reduces stiffness | Partly, via ramp ceiling |
| Ramp rate | 1 to 3°C/s typical | Fast ramps trap gradients | Yes, directly |
| Soak time | 60 to 180 s typical | Long soak equalizes gradients | Yes, directly |
| Peak temperature | Alloy dependent | Affects relaxation and cooling rate | Partly |
What this means for the rest of the guide
Warpage is not one problem with one fix. It is a stack of contributors, and the profile only touches some of them. The next section, on ramp rate control, looks at the single parameter you can change in the oven recipe that most directly changes the gradient that bends the board, and how to read that gradient off the thermocouple traces instead of off the oven’s zone setpoints.
Diagram suggestion: cross-section of an asymmetric copper stack-up with the neutral axis shifted toward the copper-heavy side and the resulting bow direction marked.
Photo suggestion: side-by-side of a warped BGA panel and a flat one, both resting on a granite surface.
Table image suggestion: bar chart of measured warpage in micrometres by laminate Tg and copper balance combination, from an internal qualification study.## Section 4: Ramp Rate Control, The Primary Driver of Thermally Induced Warpage
We talked in the last section about what bends a board. Now we get to the lever you can actually pull from the oven panel.
Ramp rate is the rate at which the board temperature climbs toward the liquidus point. That is all it is. But it decides something bigger than how fast your paste melts. It decides whether your board is flat at the end of the cycle.
The control window
For most lead-free work, keep the preheat and ramp region between roughly 1 and 3°C per second. Paste technical data sheets frequently cap the ramp somewhere near 3°C/s, and 4°C/s is generally treated as a practical ceiling for modern lead-free assemblies unless your component and laminate documentation says otherwise. Legacy Sn63Pb37 processes tolerate a similar range, though the absolute temperatures are lower.
Here is the important nuance, and it is the one most recipe sheets skip. The oven’s air setpoint ramp is not the same as the board’s ramp rate. A zone setpoint can jump 30°C in a matter of seconds while the board climbs at 1.5°C/s because copper, laminate, components, and air all have to agree on the temperature. So when we talk about ramp rate, we mean the board’s measured rate from the thermocouple trace, never the oven menu. Read it off the profiler curve.
Why a fast ramp bends the board
Here is the mechanism, and it happens before a single grain of solder melts.
When the bottom of a multilayer board heats faster than its core, the bottom wants to expand while the core does not. The top surface then wants to expand while the bottom already has. That mismatch through the thickness of the laminate creates a bending moment, and the board bows.
Now add time. A fast ramp gives the core no opportunity to catch up. The gradient at the moment the surface reaches peak can be tens of degrees across a 1.6 mm board, and the board is already bent before the solder melts. The solder then freezes that shape in place as it solidifies during cooling.
So the sequence looks like this:
- Fast ramp starts a through-thickness temperature gradient
- The gradient bends the board while the laminate is still relatively stiff
- The peak arrives, solder melts, and the assembly relaxes only slightly
- Cooling solidifies the joints and locks the residual bow into the board
The fast part is the part that matters. Slowing the ramp does not just make the melt gentler. It gives the core time to catch up, so when the peak arrives the board is closer to thermally uniform. A uniform board does not bow.
The practical fix
The move is straightforward: reduce the ramp rate and extend the soak so the gradient has time to close before you reach the reflow zone.
That sounds like a trade, and it is. You give up some line throughput and you extend cycle time. What you get back is a board that arrives at the peak zone already flat and uniform.
Here is how we would run that change on a real line. Take the recipe that currently ramps at 3.5 to 4°C/s. Pull the preheat and ramp zone setpoints down in steps, so the board’s measured ramp lands between 1.5 and 2°C/s. Then extend the soak window until the delta between the heavy-area trace and the light-area trace at the top of the soak is small enough for your board construction, usually somewhere under 15 to 20°C. Then re-run and measure flatness.
Then do it again on a production load, not an empty oven. And check the board flatness with the same gauge you used before, because comparing a new measurement against an old method is how people convince themselves of an improvement that did not happen.
Pro Insight: Read the gradient off the thermocouple traces, not off the zone setpoints. Two zones at the same setpoint tell you nothing about the temperature difference across the board. That difference between the hottest and coolest probe is the warpage risk metric, and a single sensor can never show it to you.
Internal records note: S&M marketing must replace the trace figures, gradient values, and the before/after flatness delta in millimetres below with numbers from a controlled internal validation report, including the board revision, layer count, laminate, paste, oven, and conveyor speed. Do not publish unverified figures.
| Parameter | Fast ramp trial | Adjusted trial | What we expect to see |
|—|—|—|—|
| Board ramp rate at peak | 3.5 to 4°C/s | 1.5 to 2°C/s | Measured on the board trace, not the setpoint |
| Soak window | Short | Extended | Gradient closes before the reflow zone |
| Heavy vs light area delta at peak | High | Low | Fewer degrees of mismatch through the laminate |
| Peak board temperature | Unchanged | Unchanged | Alloys and paste set the peak, not the ramp |
| Time above liquidus | Unchanged | Unchanged | Confirm after every change |
| Final board flatness | Baseline measurement | Improved measurement | Same gauge, same fixture, same operator |
| Cycle time | Baseline | Slightly longer | The cost of a flatter board |
Two cautions before you tune
First, do not change the peak to fix a gradient problem. Peak temperature belongs to the alloy and the paste data sheet. If the board is bowing because the ramp is too fast, lowering the peak makes the solder flow worse and does nothing for the bow.
Second, a slower ramp on a board with a heavy component can expose a different problem. If a large BGA or connector sits on one side, that mass lags regardless of ramp rate, and a very slow ramp can make the soak look longer while the temperature under the part still trails. That is why multi-probe profiling matters, and why we come back to sensor placement in Section 7.
A quick test you can run this week
If you want to see whether ramp rate is your warpage driver before you buy anything, run a controlled A/B on the same board family. One load at your current recipe, one load with a slower measured ramp and a longer soak. Profile both under the same production loading. Measure flatness on both with the same gauge, and inspect the same joints on both.
Two loads will not prove a statistical case, but they will tell you fast whether the direction is worth pursuing. If the flatness delta is in the noise, your warpage is coming from somewhere else, and Section 8 walks through how to chase the other suspects.
What to take into the next section: ramp rate is the parameter that controls the through-thickness gradient. The next section covers how to lay out the zones and set conveyor speed so that a good profile actually holds on the line, including the changes needed for dense military-grade assemblies.
Chart suggestion: board surface and core temperature traces side by side at a 3.5°C/s ramp and a 1.8°C/s ramp, with the delta at peak annotated.
Chart suggestion: gradient at peak plotted against final board flatness across a series of trial profiles from the internal validation record.
*Photo suggestion: the warped BGA panel and the flat panel from the same trial, resting on the same granite surface, with the measured bow in millimetres noted.## Section 5: Zone Configuration and Conveyor Setup for Uniform Heating
A good temperature profile can still die on the line. You can spend a day building a beautiful curve, write it into the oven, and then have it fall apart for reasons that have nothing to do with solder chemistry. Zone layout is usually the reason.
How the zones are arranged
A modern forced-convection reflow oven, whether it has 10 zones or 14, does the same four jobs in the same order. The zones are just the physical slices of heating and cooling that carry out that sequence.
- Preheat zones. Two to four zones bring the assembly up toward the soak band. The job here is gentle, even heat that equalizes the board, not speed.
- Soak zone. Usually one dedicated zone, sometimes two on long ovens, held in the flux activation band.
- Ramp and peak zones. Two to four zones climbing to the liquidus region and holding the peak. These are the hottest zones in the machine.
- Cooling zones. Two or more zones that bring the assembly down under controlled conditions, often a mix of forced air and a chill section.
Zones share a single conveyor, so the board passes through each in sequence. If you have looked at a reflow oven manual, you already know that the zone setpoints on the panel are not the board temperatures. They are air temperatures.
Heater balance is the symmetry knob
Most ovens drive the top and bottom heating elements separately, and the balance between them decides whether the board heats evenly through its thickness. Too much top power and the top surface outruns the core, which is the same through-thickness gradient that bends a board, just created by the oven rather than by your ramp setting.
If your oven shows separate top and bottom setpoints, treat them as a matched pair and change them together. A recipe where top runs several degrees above bottom needs a measured reason behind it, usually a board that genuinely has more thermal mass on one side.
Conveyor speed is a profile parameter
Here is the part people forget. Conveyor speed does not just move boards along. It sets how long the board spends in each zone, and therefore how long it soaks, how long it sits above liquidus, and how long it cools.
The relationship is simple enough to calculate on paper. Dwell time in a zone equals the zone length divided by conveyor speed. If your conveyor is set at 100 cm per minute and you slow it to 90 cm per minute, every zone dwell grows by roughly 11 percent. That extra soak time can push you out of the paste data sheet window just as easily as a setpoint change can.
And the effect is not proportional in the way people expect. Time above liquidus grows, but the board temperature also drops slightly because it is moving through less aggressive heat at a given setpoint, so the two changes partially offset. You cannot reason about this from the panel. Profile it.
Lock conveyor speed per recipe, treat it as a controlled parameter with the same status as a setpoint, and record it on the profile report. A speed change signed off by a shift supervisor without a re-profile is the most common way a validated reflow oven temperature profile quietly stops being valid.
Expert Tip: Before you start chasing a profile that will not hold, check three things in this order: the actual conveyor speed reading against the recipe, the load pattern in the oven, and the top-versus-bottom setpoint balance. In our experience the conveyor speed is the culprit more often than the heat recipe.
Diagnosing a non-uniform profile
When a board profile looks wrong on the line but looks right on the bench, the difference is usually one of these three.
Load pattern. A densely loaded board shields its neighbours from radiant and convected heat, and a board running in the first position of a full load sees different airflow than one running mid-oven. Profile under production loading, and if the first board out is running cold, that is usually the answer. Spacing between boards on the conveyor matters too. Boards packed shoulder to shoulder change the airflow over the top surface.
Recirculation. Every oven recirculates hot air through a plenum and a fan or fans. A degraded fan moves less air than the design intends, and the board sits in a less uniform thermal field even though the zone setpoints still read correctly. Check fan performance against the maintenance schedule in the oven manual, and treat any unusual board-to-board variation as a fan question until proven otherwise.
Top and bottom heater balance. Read the zone panel top and bottom values and compare them zone by zone. If the difference is larger than your recipe calls for, the oven or the recipe has drifted, not your board.
A zone-by-zone starting template
The table below is the shape we start from for a lead-free SAC305 process on a multilayer board. Treat it as orientation only. Your paste data sheet, your component limits, and your own measured board profile decide the real numbers.
| Zone | Function | Typical lead-free setpoint | Airflow | Top/bottom balance |
|—|—|—|—|—|
| 1 | Preheat, gentle rise | 130 to 160°C | Moderate, high recirculation | Equal |
| 2 | Preheat toward soak band | 150 to 180°C | Moderate | Equal |
| 3 | Soak | 170 to 200°C | Even, low turbulence | Equal, or top slightly lower on top-heavy boards |
| 4 | Soak continuation | 180 to 200°C | Even | Matched |
| 5 | Ramp to liquidus | 200 to 215°C | Moderate | Equal |
| 6 | Ramp toward peak | 220 to 235°C | High | Equal |
| 7 | Peak | 235 to 245°C | High | Equal |
| 8 | Peak hold | 240 to 250°C | High | Matched |
| 9 | Controlled cool | 200 to 215°C | Increasing | Equal |
| 10 | Forced chill | 150°C and below | Maximum | Equal |
A real case: dense military-grade assembly
Here is the situation we handled recently. A military-grade board with a large BGA, a heavy backplane connector, and dense dual-sided parts. The original recipe used a 10-zone oven with an aggressive preheat ramp, and the assemblies were arriving with a consistent bow concentrated on the connector end.
We did not change the peak at all. We redistributed the zones instead. Two zones were moved out of the ramp section and into the soak section, which stretched soak time and dropped the measured board ramp. Then we pulled the conveyor back slightly to hold the soak window, and we re-profiled at full production load with a board in the first position and one mid-oven.
The connector end flattened out, and the joint quality on the BGA improved with it. The lesson was that the fix lived in the zone map and the conveyor, not in the temperature numbers people usually reach for.
Internal records note: replace the case details above with the board revision, layer count, laminate, paste type, oven model, before and after conveyor speed, and measured flatness delta from the controlled validation record before publication. Do not publish unverified figures.
What to take into the next section
Zone layout and conveyor speed determine whether the profile you measured on the bench still exists on the line. The next section covers measurement, where the real limits of what you can know come from, and how many thermocouples you actually need.
Diagram suggestion: airflow path through a 10-zone oven, showing the recirculation plenum, fan layout, top and bottom heater banks, and the direction of board travel.
Table image suggestion: the zone-by-zone setpoint template rendered as a chart image with the four jobs annotated.
Photo suggestion: interior of an S&M lead-free reflow oven with the zone modules visible.## Section 6: Typical Reflow Temperature Profiles for Lead-Free and Legacy Solder Alloys
Ask five engineers for a “typical reflow temperature profile” and you will get five answers, all of them within about ten degrees of each other. That is not a problem. The problem starts when somebody treats any one of those numbers as the spec for a board they have never seen.
So let us start with what a typical reflow temperature profile actually is. It is a reference window for an alloy family, drawn from paste technical data sheets and general process practice. It is the starting point for your own profile, never the end of it. The final numbers come from the paste you buy, the parts you place, and the board you build.
The SAC305 lead-free reference profile
SAC305 (Sn96.5Ag3Cu0.5) is the workhorse of consumer electronics, and this is the window most lines run today.
| Stage | Target | Practical tolerance band |
|—|—|—|
| Preheat / soak temperature | 150 to 180°C | 150 to 200°C depending on paste flux chemistry |
| Soak duration | 60 to 120 s | 60 to 180 s, set by paste data sheet |
| Ramp to peak | 1 to 3°C/s | 3°C/s typical ceiling, 4°C/s absolute practical maximum |
| Peak temperature | 235 to 245°C | No more than 5°C above the alloy liquidus plus wetting margin |
| Time above liquidus | 30 to 90 s | 45 to 60 s is a common starting target |
| Cooling ramp | 1 to 4°C/s | Forced chill below 150°C |
If you take one thing from this guide, take the ramp ceiling. Paste data sheets for SAC305 usually cap ramp somewhere near 3°C per second. That ceiling is not about solder chemistry, it is about keeping the board flat and giving the core time to catch up with the surface.
The legacy Sn63Pb37 profile
Eutectic tin-lead melts at 183°C, and that single fact changes the whole profile. Preheat sits lower, typically 100 to 150°C. Soak runs 60 to 120 seconds. Peak lands around 215 to 225°C, roughly 30°C above liquidus, which gives plenty of wetting margin without going near the 260°C component ceiling.
The soak ramp can be a little more aggressive on legacy work, and cooling is often handled with a harder forced chill. Time above liquidus still runs 30 to 90 seconds.
One thing to watch during any legacy to lead-free conversion: lead-free alloys need more aggressive flux activation, narrower operating windows, and different solder balling and bridging behavior. If your equipment still sits in a 225°C world, the oven itself, not just the recipe, may need attention. That is where the reflow oven manual for your specific machine becomes genuinely useful.
The high-temperature lead-free profile
Ag-bearing alloys such as SAC405 sit in the same general liquidus region, around 215 to 220°C, but their working peak is much higher, typically 245 to 260°C. This is the profile family you meet in automotive, military, and aerospace work, where service temperature drives the alloy choice.
This is the tightest profile of the three. The peak lands close to the component maximum body temperature limit, and many packages specify 260°C with little margin. Soak for SAC405 style pastes runs 60 to 180 seconds, often in a wider 150 to 220°C band because the flux system has to work harder. Component body limits, not paste settings, become the governing constraint.
Profile variants by board density
Same alloy, different board, different profile. This is where a lot of the “one chart fits all” thinking falls apart.
Fine-pitch BGA and QFN. These need a tighter, slower ramp, usually 1 to 1.5°C/s, with a well-equalized soak and more thermocouple coverage. Fine-pitch joints fail on insufficient wetting, and they fail quietly. You need the temperature difference across the package to be small, which means more probes, not fewer.
Large, thermally massive boards. A big multilayer board or one with a heavy connector needs a longer soak, often 120 to 180 seconds, to bring the core up toward the surface temperature. Rush the ramp and the surface gets to peak while the core is still cool, and you are back to the gradient problem from the last section.
Low-density small boards. These are the most forgiving. A short soak and a moderate ramp usually work, which is why they are the easiest boards to qualify and the hardest ones to learn from.
From our experience: three programs, three windows
We have run this exercise across three very different production programs. On a smartphone line with dense BGA and QFN on a thin multilayer, the validated window sat at a 1.5°C/s ramp with a 150 to 180°C soak running about 90 seconds, peak at 240°C, and time above liquidus near 50 seconds. Joint quality held and final-test yield was stable.
A semiconductor packaging program with a heavy lead frame and substantial thermal mass needed a longer soak, closer to 150 seconds, with the same peak. The shorter soak left voids in the larger joints that X-ray flagged consistently.
A military-grade assembly on a thick laminate took a slower ramp and a longer soak still, because the board had to survive thermal cycling qualification and the profile had to leave as little residual stress as possible.
Internal records note: S&M marketing must replace the case windows above with the actual board revision, layer count, laminate, paste type, oven model, conveyor speed, and observed defect rates from the controlled validation records before publication. Do not publish unverified figures.
One clarification worth making
J-STD-020 shows up constantly in reflow discussions, and it is often misused. It is a component moisture-sensitivity classification standard. It tells you how many reflow cycles a part is rated for and how long that part may sit open before baking is required. It is not a production recipe, and a J-STD-020 classification profile is not a substitute for your paste data sheet.
Putting it on one chart
The visual that makes this usable is a single overlay of four curves: SAC305, Sn63Pb37, high-temperature lead-free, and a fine-pitch BGA variant of SAC305 with its slower ramp marked. Once you see them together, the differences stop being abstract.
[Full-page chart suggestion: the best reflow oven temperature profile chart, with four reference profiles overlaid and the soak, ramp, peak, and cooling stages annotated for each alloy family.]
[Table image suggestion: the numeric targets and tolerance bands above, rendered as a printable shop-floor reference card.]
What to take into the next section: the alloy windows give you candidate numbers. The next section covers reflow oven temperature profile measurement and instrumentation, including where to attach thermocouples, how many you actually need, and why a single sensor can never tell you what you really need to know.
Photo suggestion: four finished assemblies, one per profile family, resting on granite, showing the flatness difference across a RoHS conversion program.## Section 7: Reflow Oven Temperature Profile Measurement and Instrumentation
A temperature profile is only as good as the measurement behind it. This section covers the instrument chain that turns a board travelling through the oven into a temperature-time trace you can actually trust, plus the placement rules that decide whether that trace means anything.
The measurement chain, end to end
Three pieces do the work.
A fine-wire thermocouple. For PCB profiling, a Type-K junction with fine wire, roughly 0.2 mm diameter, is the common choice. It is thin enough that it does not act as a heat sink on a small pad or trace, and it survives the temperatures involved.
A data logger. The profiler records the thermocouple output over time, usually at one sample per second or faster. It sits beside the oven, not inside it.
Analysis software. The logger renders the raw data as a temperature-time curve, and the software lets you overlay the paste supplier’s process window, mark soak, peak, time above liquidus, and ramp segments, and export the result.
That exported result is what most people mean when someone asks for the “reflow oven temperature profile PDF.” It is not a vendor template you download from the internet. It is a report generated from your own run, and it should carry the board revision, paste type and lot, oven identifier, recipe and zone setpoints, conveyor speed, load pattern, thermocouple positions, operator, and date. If a PDF of your profile has none of that, it is a picture of somebody else’s process.
You will also see “reflow oven temperature profile chart” requests in the same conversations. Same idea. The chart is the output; the record is the document.
Where the thermocouple actually goes
This is the part that gets rushed, and it is where measurement bias creeps in.
The junction must sit on the PCB surface, bonded to the laminate, so the reading reflects board temperature. It must not sit on top of a solder blob, on paste, or on a component body, because then you are measuring something other than the board. A thermocouple clipped to a large connector tells you the connector’s temperature. Useful information, but not a board profile.
Expert Tip: Attach a second thermocouple at the point you expect to be the coldest, not just the hottest. The delta between your warmest and coolest probe is the warpage risk metric, and a single sensor can never show it to you. Put one on a heavy copper region and one on a light component area as a minimum, then add a corner and a fine-pitch joint for dense assemblies.
For a typical rigid board, work through these sites:
- Heaviest copper region. A ground plane, a large pour, a heavy connector land. This area lags the setpoint and defines your slowest thermal response.
- Lightest area. A small component, a narrow trace, a bare corner. This runs ahead of everything else and often sets your true peak.
- A fine-pitch joint. Attach immediately beside a representative BGA or QFN, not on top of it. Fine-pitch failures are wetting failures, and wetting depends on local temperature.
- A board corner or edge. Corners see different airflow from the centre and often run cooler.
- Under or beside a heavy package, when the package dominates the thermal mass.
Three or four probes is a reasonable starting point. A dense, large, multilayer assembly needs more. There is no single right number, and the honest test is whether your probes bracket the extremes you need to know about.
Attachment methods and their trade-offs
| Method | Strength | Watch out for |
|—|—|—|
| High-temperature solder on the junction | Good thermal contact, low added mass | Requires a hot iron and care not to lift a pad or trace |
| Kapton or polyimide tape | Fast, non-invasive, standard | Watch the tape’s own response and keep the tape patch small |
| High-temperature epoxy or conductive adhesive | Durable, repeatable | Adds mass and can insulate if the layer is too thick |
| Mechanical clamp | No heat or chemicals on the board | Can press on components and shift the junction |
| Drilled or embedded sensor | Accurate at a known point | Requires a prepared board, not production hardware |
Whatever you use, route the fine wire along the board surface for a short distance before it leaves the area. Minimise exposed wire, and avoid large adhesive masses, because both insulate the junction and add their own delay to the reading.
Comparing the tool categories
Single-board thermocouple profiling. This is the industry-standard method for validation, and it is the method this guide assumes. It is accurate, repeatable, and it gives you a real board trace. The cost is setup time and the fact that you are profiling one instrumented board at a time, with the other boards in the load acting as heat loads.
Infrared thermal imaging. Useful as a fast screening pass. The camera sees the whole board surface at once, which is great for spotting hot spots across a population rather than at a point. But be careful with the shiny surfaces on a populated board. Bare copper, solder mask, and shiny component bodies all reflect infrared radiation, so the camera mixes emitted and reflected energy and the apparent temperature can read far higher or lower than the real surface temperature. Use it to find where to place your thermocouples, not to accept or reject a profile.
Furnace and board-scanning profilers. These move a sensor over a board, or a board through a controlled thermal environment, and they generate a map of the whole assembly rather than a handful of points. They are the right tool for capability studies and for large-volume characterisation, where you want to know the distribution across a board population. They cost more and take longer, so they sit above thermocouple profiling rather than replacing it on the line.
How many boards per lot to profile
Profiling frequency is a sampling decision, and it belongs in your control plan rather than in somebody’s head.
Profile at the start of a build, after any oven maintenance, after a recipe change, and after any change in board revision, paste lot, or load pattern. For ongoing production, profile on a defined interval and always profile under representative loading, including the first board position in the oven if that position behaves differently.
The number of boards inside a lot for the run itself is a separate thing. Load the oven the way production loads it, with the same number of boards, the same spacing, and the same orientation. A profile captured on an empty oven is a commissioning record, not a production profile.
What a defensible report contains
A good reflow oven temperature profile measurement report lets somebody else reproduce the run. At minimum it should record:
- Board revision, layer count, laminate type, and panel size
- Paste type and lot, with the process window used as the reference
- Oven identifier, recipe, zone setpoints, and top/bottom balance
- Conveyor speed and load pattern, including board positions profiled
- Thermocouple type, locations, and attachment method
- Measured soak, ramp, peak, time above liquidus, and cooling rate at each probe
- The maximum delta between the warmest and coolest probe
- Post-run inspection results and measured board flatness
- Operator, date, and the standard or customer specification referenced
That last line matters. Check the current revision of any standard you name against the official IPC and JEDEC catalogs at publication time, and write the exact paste data sheet revision into the record.
Where this sits in the workflow
Profiling is not a step you do once and file away. It is the loop that turns an oven recipe into a controlled process, and the next section covers the other half of that loop: what drifts on the oven itself over a year of production, how often you should re-verify, and what a detected drift looks like before it shows up in your final test numbers.
If you are running a line where profiles keep coming back slightly different after maintenance, or if you want to see how a validated profile gets built from scratch on a new board family, the S&M Co. Ltd. equipment range covers the ovens, wave soldering systems, and full SMT lines built for this kind of high-density, high-volume work.
What to take into the next section: you now have a trace you can trust and a record that documents it. Next, how to keep it: what drifts on a reflow oven over a year, how often to re-verify, and how to catch the drift before it reaches your final test data.
Image suggestion: annotated close-up of a Type-K junction bonded to a BGA board, with the wire routing and Kapton attachment visible.
Image suggestion: profiler software screen showing the recorded trace with the paste process window overlaid and the soak, peak, and TAL segments marked.
Image suggestion: a sample reflow oven temperature profile PDF report layout with the metadata fields visible.
Video suggestion: a 30-second clip showing thermocouple attachment on a populated BGA board, from junction placement through tape securing.## Section 8: Diagnostics, Reading Warpage, Voiding, and Other Defect Signatures Back Into the Profile
Somewhere around 6:15 on a Wednesday, the X-ray station flags a tray of BGA boards for voids. Somebody walks to the oven, checks the recipe, and finds nothing obviously wrong. Same paste, same zone setpoints, same conveyor speed as yesterday. So what happened?
This is where a reflow profile stops being a chart and starts being a diagnostic tool. Every defect on the board carries a thermal signature, and if you know how to read the trace you can usually tell which parameter is guilty before you start swapping paste lots.
One warning before we go further. Most defect symptoms have more than one cause, and the profile is only one suspect in the room. A void can come from the profile, from the paste print, from the stencil, from the placement, or from a bake. We will map profile causes here, but the habit of blaming the oven first is exactly backwards.
The defect to profile symptom table
| Defect | What you see | Profile symptom | Most likely profile cause | Corrective action |
|—|—|—|—|—|
| Bowed or cupped PCB | Board does not sit flat on granite; corner lifts | Heavy-to-light delta still wide at peak; short flat soak | Soak too short, ramp too fast, gradient never equalized | Extend soak, drop measured ramp to 1.5 to 2°C/s, re-measure |
| Cracked BGA corner joint | Intermittent open that passes at room temp, fails at temperature | No obvious peak anomaly; board shows residual bow | Warpage-driven shear, amplified by asymmetric copper | Fix flatness first; check package coplanarity separately |
| Solder balling | Small spheres on pads or in the field | Spiked trace, noisy soak region, poor wetting elsewhere | Excess time above liquidus or aggressive ramp causing spatter | Tighten TAL to the paste window, soften ramp, review flux activity |
| Tombstoning | One end of a chip component lifted | Very sharp peak, short TAL | Component heated before its pad, then sloughed during melt | Extend soak so the part catches up, add a longer ramp |
| Insufficient wetting | Dull, grainy, high contact angle joints | Peak marginal or TAL short | Underheating for the alloy, or oxidation from too little flux activation | Raise peak within paste and component limits, extend TAL |
| Excessive voiding | X-ray shows gas voids in large joints | Soak too brief for the joint volume, peak marginal | Flux did not outgas before liquidus; or joint too large for the profile | Lengthen soak, verify peak, check paste print volume |
| Intermetallic separation | Brittle-looking, dull grain at joint interior | Excess dwell at peak | Overheating, long time above liquidus | Reduce peak and TAL to the paste window |
| Discoloration or burnt pads | Charred mask, exposed pad damage | Trace far above paste peak | Zone setpoint runaway or thermocouple not on the board | Check sensor attachment and oven control loop |
| Insufficient wetting after rework | Cold joint on a hand-touched part | Not a profile signature | Manual rework temperature, not the oven | Fix the rework station, not the recipe |
The convex curve tell
There is a shape diagnostic that comes up often enough to name. When the recorded trace has a broad, rounded, almost bathtub shape under the peak instead of a defined plateau, you are usually looking at an under-soaked board. The board never held long enough in the flux activation band to equalize, so the heavy copper areas and the light areas arrived at the peak at different temperatures, and the trace flattens out only because the peak zone masked the difference.
The opposite read works too. A trace with a narrow, sharply peaked spike above the paste window suggests an over-hot zone setpoint or a poorly attached thermocouple reading air rather than board. Check the sensor before you blame the oven.
Both of these are pattern reads, not proof. Treat them as a starting hypothesis, then confirm with the joints and the flatness measurement.
Fix in the right order
Here is the sequencing rule that saves the most time: ramp and soak first, peak last.
Peak temperature is the parameter everybody reaches for. It is also the one most tightly constrained by the paste data sheet and the component supplier’s limits, so changing it trades one problem for another. If a board is bowing, lowering the peak makes the solder flow worse and will not straighten the laminate.
The correct order is:
- Measure the actual board ramp rate and the heavy-to-light delta at the top of the soak.
- Fix the ramp if the measured rate is above the paste ceiling.
- Fix the soak until the delta closes.
- Re-measure flatness and joint quality before touching anything else.
- Adjust peak and TAL only if joints still show wetting or voiding problems after the first three are clean.
And change one variable at a time. Two changes at once means two unknowns.
A case we traced back to a soak setpoint
Here is the warpage complaint we handled recently, and it is worth walking through because the initial assumption was wrong.
A customer reported increasing warpage on a multilayer assembly over roughly a month of production. The paste had not changed. The board revision had not changed. The oven recipe had not been touched by anyone. On paper, nothing had moved.
The profile record told a different story. The board revision had changed in the middle of that month, not the paste. The new revision carried a heavier ground plane on the bottom side, and the soak zone setpoint stayed exactly where it was. The board was running hotter for longer during soak, the flux was being over-activated, and the soak was effectively shortened on the assembly because the board reached the band later and exited it later.
The correction was not a peak change and not a paste change. We lowered the soak zone setpoint slightly and lengthened the dwell to hold the board inside the flux band for the required time, then re-profiled under full production load. The flatness delta moved back into the customer limit, and the joint quality on the fine-pitch parts improved at the same time.
The lesson worth keeping: when warpage appears without a recipe change, look at what changed upstream of the oven. The oven was faithfully doing what it was told.
Internal records note: replace the case above with the board revision, layer count, laminate, paste type, oven model, soak setpoints before and after, conveyor speed, and the measured flatness delta from the controlled validation record before publication. Do not publish unverified figures.
What X-ray can and cannot tell you
X-ray inspection of a solder joint is one of the most useful diagnostics on the shop floor, and it is also one of the most over-interpreted.
Void percentage correlates with soak and peak in a rough way. Joints that see adequate soak and reach peak properly tend to outgas and fill cleanly. Joints that see a short soak or a marginal peak tend to trap gas. That correlation is real and useful.
What X-ray cannot do is tell you which of several causes produced the void. A large void in a large joint can be a profile problem, a paste print volume problem, an issue with the component’s own plating and outgassing, or a stencil aperture problem. The voiding rules you accept against should come from your customer specification and the component supplier’s guidance, checked against the current revision of IPC-A-610 and IPC/JEDEC-9704 in the official catalogs at publication time. There is no universal void percentage limit that applies to every product on every line.
One practical tip: when X-ray flags voids, check where they are before you change anything. Voids clustered in one region of the board point at a thermal issue. Voids distributed evenly across all joints on the board point at paste or print volume.
A short diagnostic sequence you can run tomorrow
When a defect shows up and you suspect the profile, work through this in order and stop at the first step that explains it.
- Pull the last profile record for that board family and compare it to the run before the defect appeared.
- Check the actual conveyor speed reading against the recipe. A shift sign-off without a re-profile is a common culprit.
- Check the load pattern. Boards running in the first position of a full oven behave differently.
- Compare the current trace shape against the baseline: soak plateau, peak height, TAL, and the heavy-to-light delta.
- Inspect the joints and read the flatness on the same gauge you used for the baseline.
- Change one parameter, re-profile under production load, and compare.
If you would rather watch this than read it, the S&M Co. Ltd. equipment range covers lead-free reflow ovens and wave soldering systems built for high-density, high-volume lines, and the team can walk your board family through a profile build and validation on real product.
What to take into the next section: the profile tells you what changed. The next section covers what changes on the oven itself over a year of production, how often to re-verify, and how to catch drift before it shows up in final test data.
Image suggestion: side-by-side X-ray micrographs of a well-formed BGA joint and a voided joint from the same board.
Image suggestion: a trended chart of heavy-to-light delta at peak plotted against measured board flatness, from an internal validation record.
Chart suggestion: a convex soak trace overlaid against a defined soak plateau, annotated with the corrective action for each.