
Published: 19 October 2026 (last updated 19 October 2026)
Reading Time: 13 minutes
Author: [Author name and credentials pending verification]
Technical Reviewer: [Technical reviewer name and credentials, if appointed]
This article is currently under development. Author and technical reviewer information will be added once credentials have been verified. No content should be presented as reviewed or approved by any named SMT process engineering expert, IPC-certified professional, or professionally licensed authority until those designations are independently documented.> Published: 19 October 2026 (last updated 19 October 2026)
Reading Time: 13 minutes
Author: [Author name and credentials pending verification]
Technical Reviewer: [Technical reviewer name and credentials, if appointed]
This article is currently under development. Author and technical reviewer information will be added once credentials have been verified. No content should be presented as reviewed or approved by any named SMT process engineering expert, IPC-certified professional, or professionally licensed authority until those designations are independently documented.
Why Conveyor Speed Determines Reflow Quality and Throughput
Imagine your SMT line humming along nicely. Paste print looks good. Placement is on target. Then boards hit the reflow oven and problems start showing up at AOI. Cold joints here. Voiding there. Maybe a tombstoned passive or two. Sound familiar?
The conveyor reflow oven is where all your earlier work either comes together or falls apart. And the humble belt speed setting sitting in the oven controller? That single number controls everything. It decides how long your board spends in each heating zone, the total time it lives inside the oven, and ultimately whether those solder joints form correctly or end up in the scrap bin.
In 2026, with lead-free alloys now standard and component packages getting smaller and more thermally sensitive (looking at you, QFN and BGA), nailing this setting matters more than ever. Too fast and components don’t soak evenly. Too slow and you risk damaging heat-sensitive parts or creating excessive intermetallic layers. Get it right and you maximize throughput without sacrificing yield.
This guide walks you through how a conveyor reflow oven works, how to calculate a starting speed, what to watch for at the exit, and how to size an oven for your production needs. We’ll focus on the math you can actually use on the shop floor, not just textbook theory. Along the way, we’ll reference IPC-7530A profiling guidance and current solder paste data sheets so you have real numbers to work with instead of guesswork.
About the Author
[Author name] is [verified role/credential] with [verified years or type of experience] in SMT reflow profiling, soldering-process control, or electronics manufacturing. [He/She/They] has [verified experience or achievement involving conveyor reflow ovens, lead-free production, BGA/QFN assemblies, or line integration].
This author biography will be updated with verified credentials and documented experience once the author’s professional background has been independently confirmed. All article content should be evaluated on its technical merits using the cited IPC standards, solder paste manufacturer data sheets, and equipment specifications referenced throughout.
1. How a Conveyor Reflow Oven Works
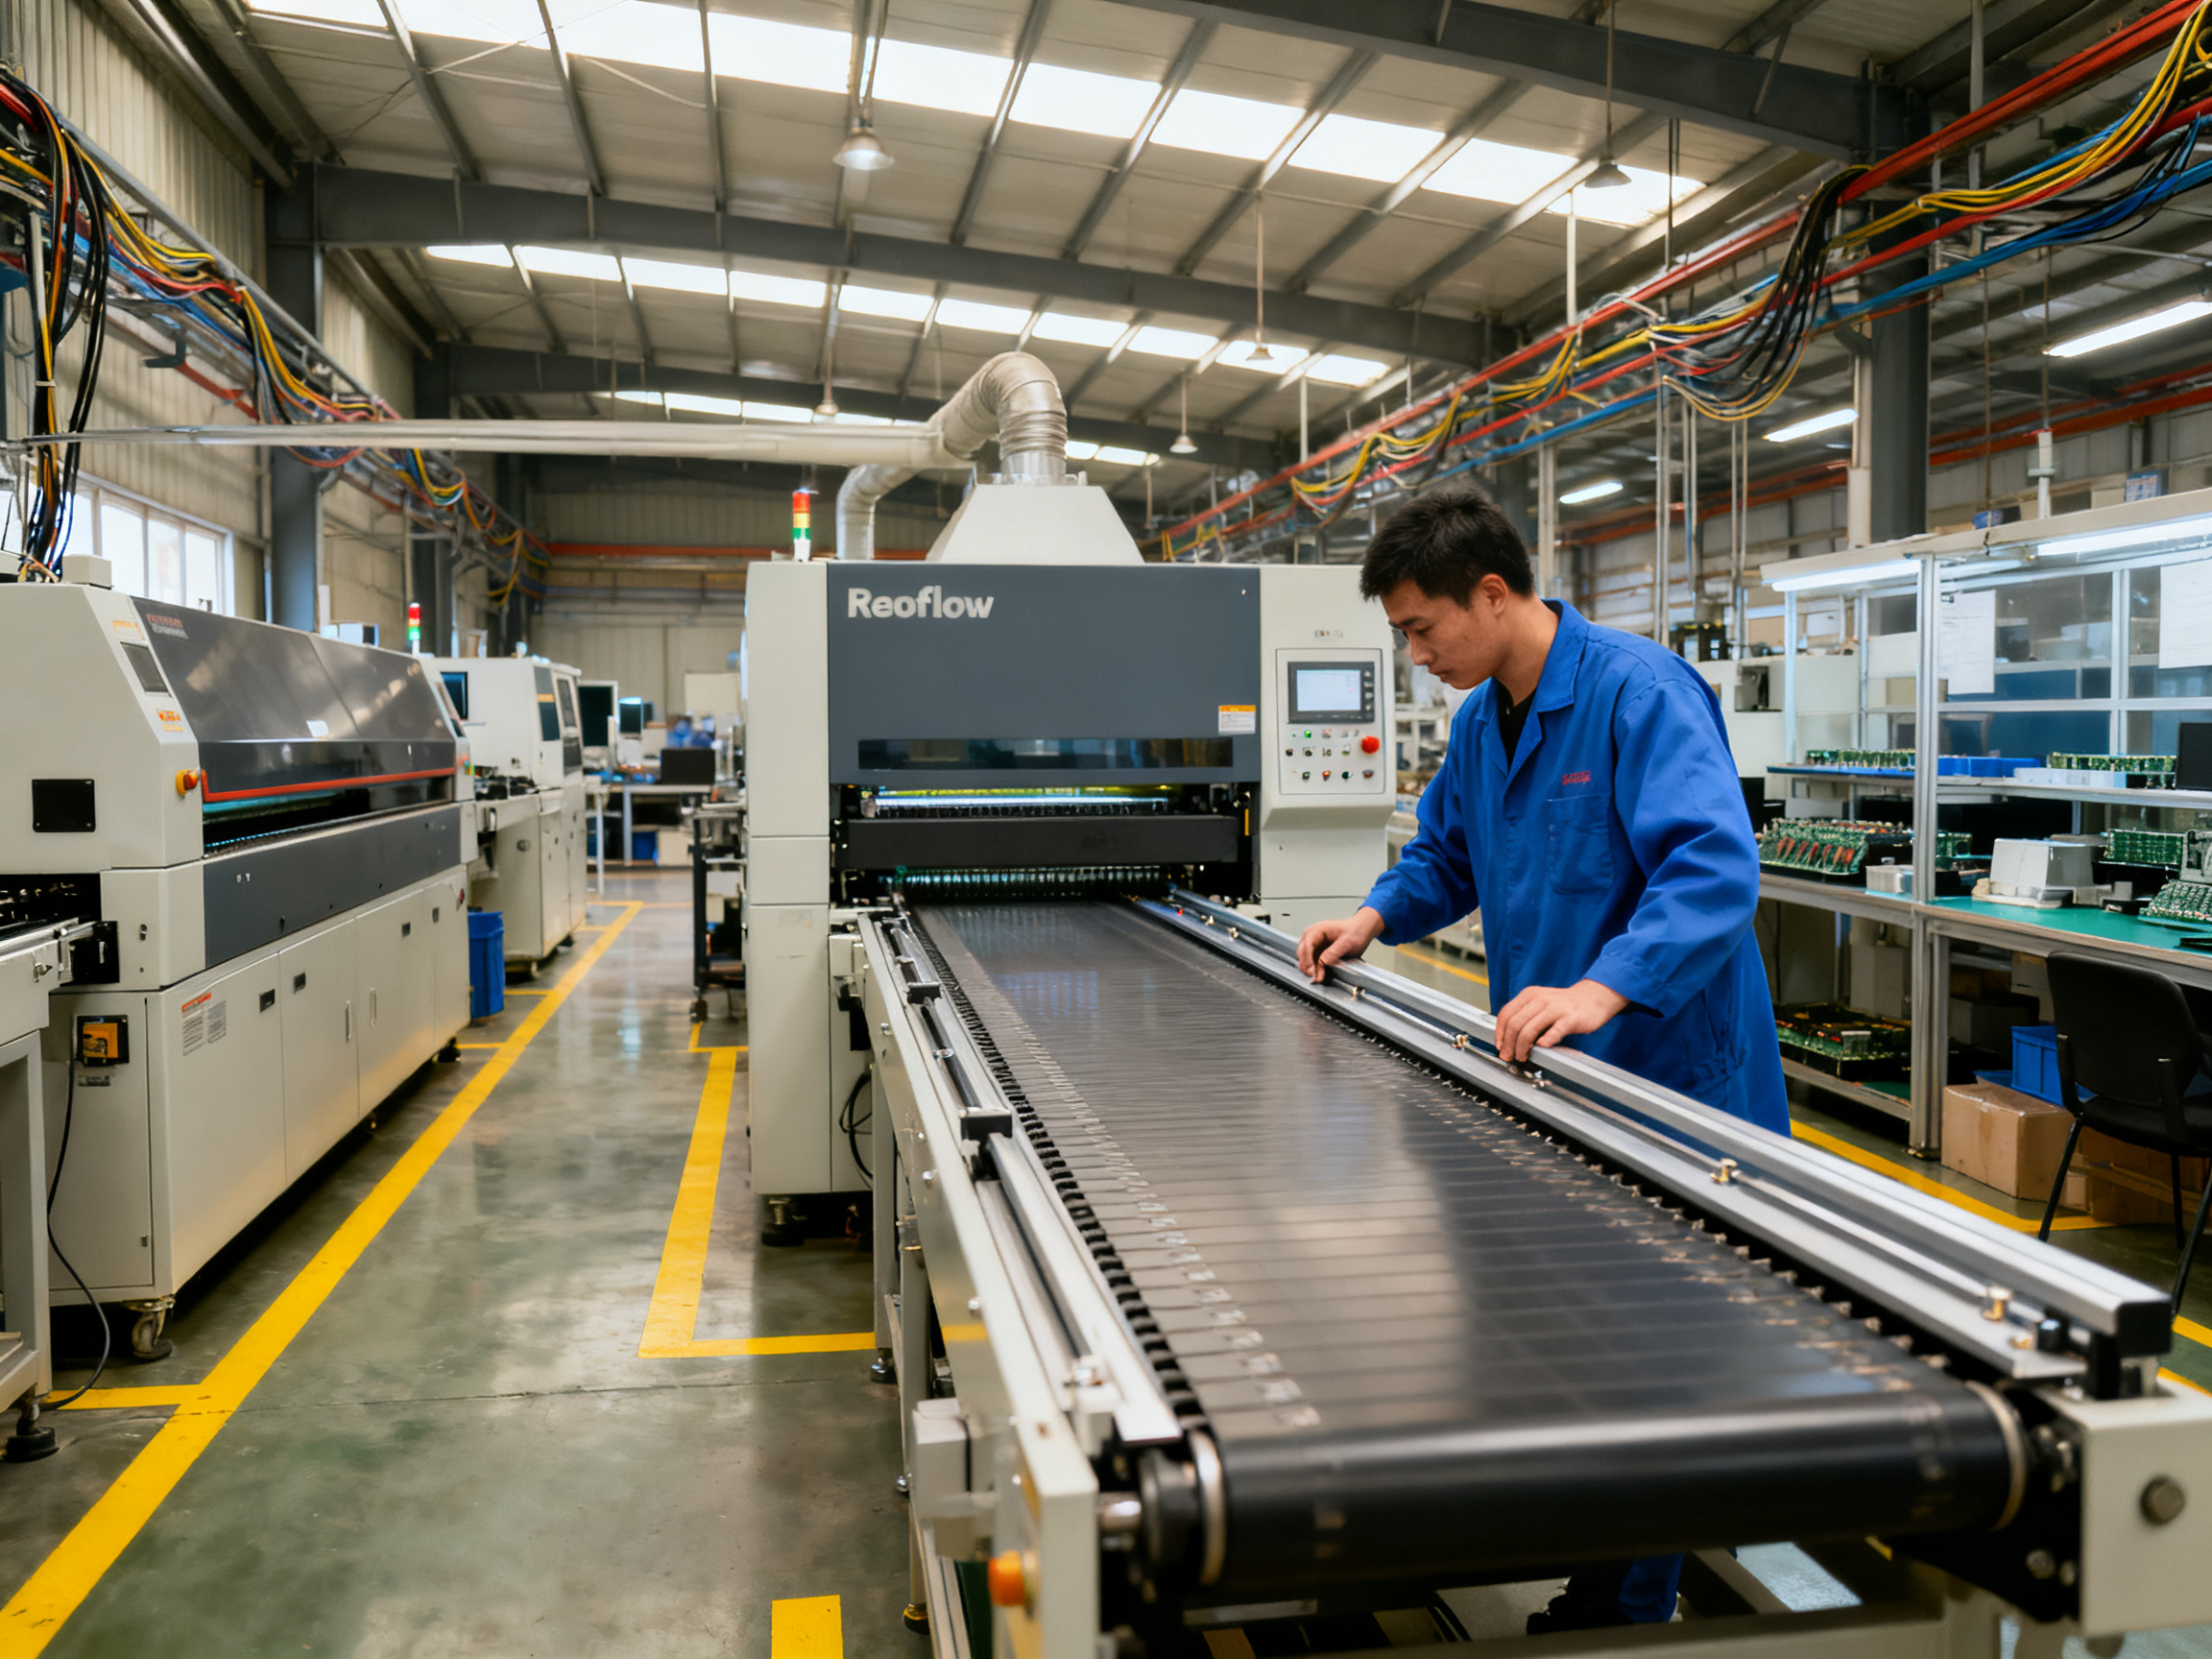
Think of a conveyor reflow oven as a heated tunnel on wheels. Well, not literally on wheels, but the belt inside moves your boards through different temperature zones from the moment they enter to when they exit.
The Basic Journey
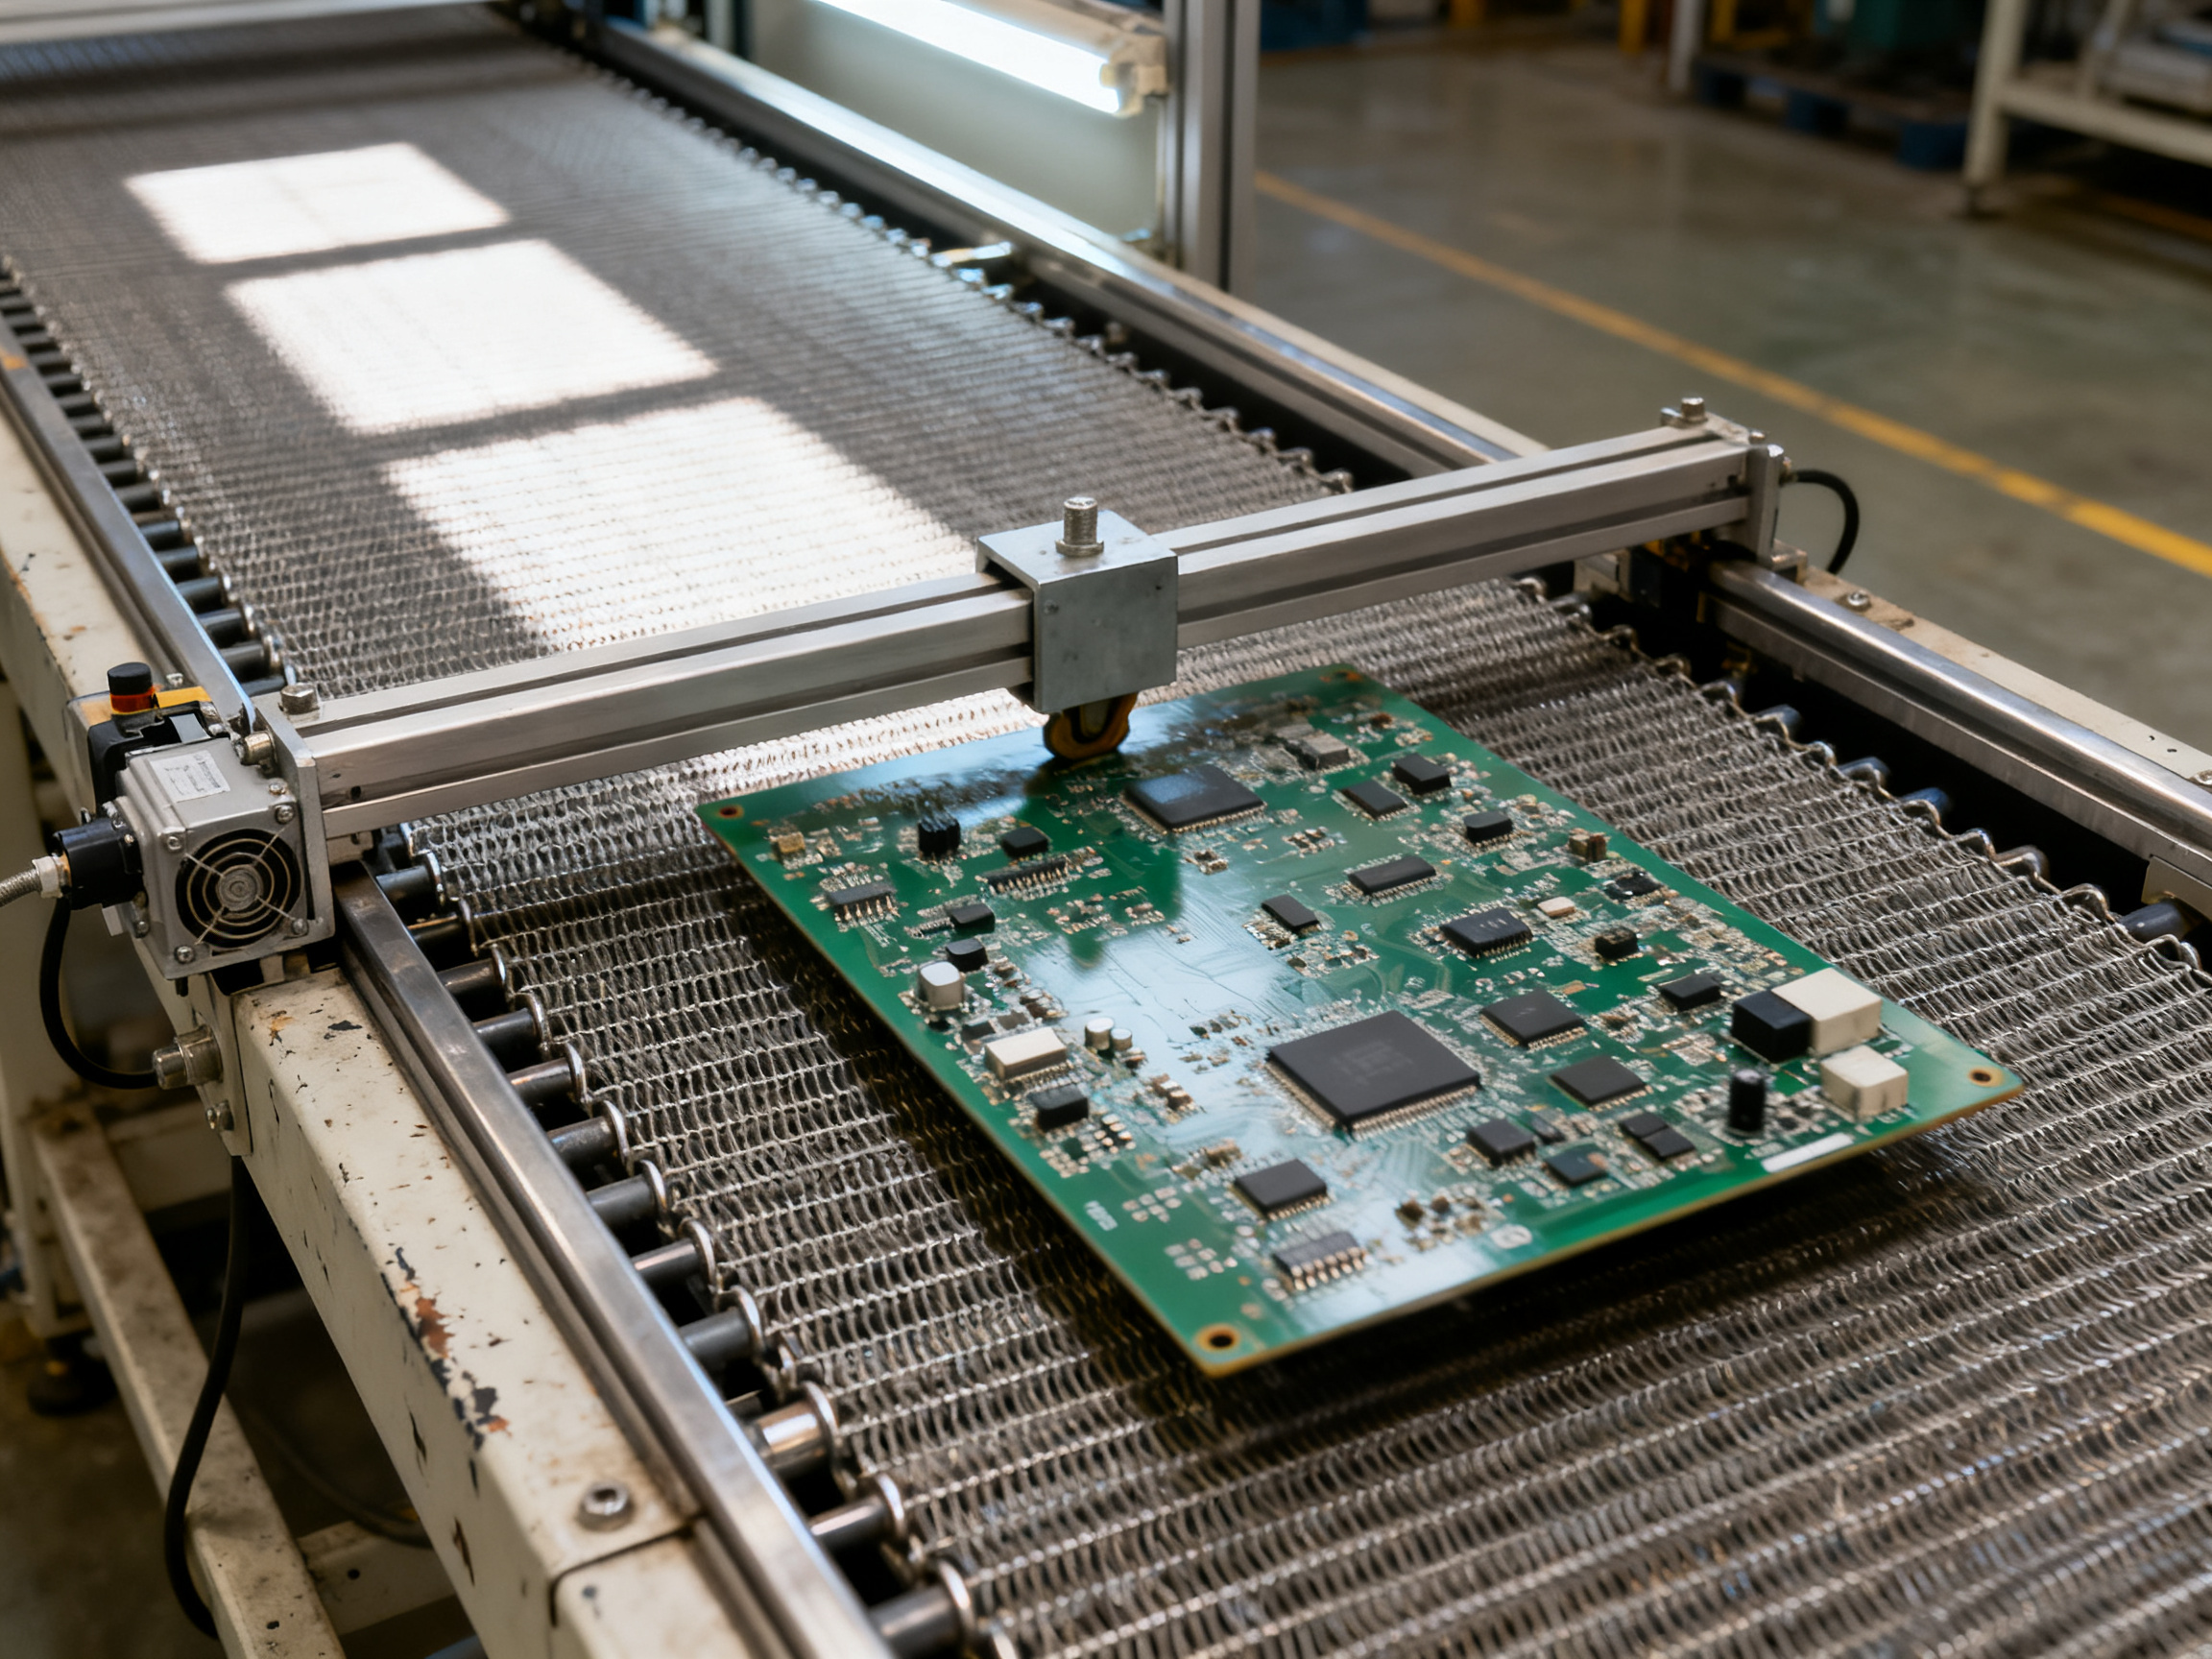
Your board starts at the entrance. The conveyor belt, usually a stainless steel mesh or dual rails depending on your oven model, carries it forward at a set speed. No matter what oven brand you’re running, the journey looks the same.
Preheat zone: The board temperature rises gradually. Solder paste solvent burns off. Components and PCB warm up together without thermal shock. Most ovens use forced convection here, meaning fans push hot air across the board surface for even heating.
Soak zone: Temperature holds steady in a lower range. This gives large components like BGAs time to catch up with smaller parts. Flux activates. The board soaks evenly before hitting peak heat.
Reflow zone: This is where solder melts. The board reaches peak temperature, typically 230 to 260 degrees Celsius for lead-free SAC alloys. Liquid solder wets the component leads and pads, forming the actual joints.
Cooling zone: Temperature drops. Solder solidifies. Proper cooling rate, around 2 to 4 degrees Celsius per second for most pastes, gives you shiny, reliable joints without cracks or voids.
What Actually Controls Temperature
Here’s the thing most guides skip. The zone temperatures you set on the controller are just targets. What your board actually experiences depends on a bunch of factors working together.
Conveyor speed matters most. Move the belt faster and your board spends less time in each zone. Slower means more time under heat. The oven’s heated length divided by belt speed gives you total dwell time.
Board thermal mass plays a huge role too. A heavy 3mm thick board with lots of copper absorbs heat differently than a thin, light one. Dense copper areas act like heat sinks, pulling energy away from nearby components.
Airflow patterns, whether the oven runs with one or two lanes, even the color of your components, all influence the real board temperature. This is why you profile with thermocouples attached to actual products instead of trusting zone settings alone.
SMT Line Integration
Modern ovens don’t work alone. They talk to adjacent equipment using standard protocols.
SMEMA, the Surface Mount Equipment Manufacturers Association standard, handles basic transfer signals. A board tells the upstream machine “I’m here” and the downstream machine “I’m coming.” Simple stuff.
Hermes, released as IPC-HERMES-9852, does more. It shares board ID, routing instructions, and downstream readiness status. If your AOI upstream needs an extra second, Hermes can delay the oven.
IPC-CFX goes further still. It connects the whole line for real-time traceability. Every board’s thermal profile gets logged. Every alarm gets timestamped. This matters for automotive and aerospace customers who need proof the process stayed in control.
Most production lines also use width-adjustable rails that center boards automatically, center conveyor supports for heavy panels, and edge clearance sensors that flag potential jams. Alarms trigger when boards stack up or when temperature drifts outside limits.
Equipment like S&M Co. Ltd. reflow ovens follow these same integration principles, connecting to SMT lines through standard protocols while managing the thermal profile that determines your yield.
Pro Insight: When you’re evaluating ovens, don’t just count zones. Ask about the heated length that actually contributes to your thermal profile. An oven with lots of zones but short effective length might force you to run slower than a longer oven with fewer zones.
Understanding how these pieces work together helps you make better decisions about speed settings, profile development, and troubleshooting when things go wrong.
2. Calculate Reflow Oven Conveyor Speed and Zone Dwell Time
Now for the math that actually matters on the shop floor. The core relationships are straightforward.
Total dwell time tells you how long your board spends in the heated section. You calculate it as effective heated length divided by belt speed.
Zone dwell time breaks this down zone by zone. Each zone’s contribution equals that zone’s effective length divided by belt speed.
Belt speed itself comes from rearranging: you take the effective heated length and divide by your target total residence time.
Here’s the thing though. The zone lengths in your oven spec sheet are nominal. In reality, temperature transitions happen gradually, not instantly at zone boundaries. So when you calculate zone dwell times, treat those numbers as approximations. The transition regions between zones mean your board spends some time in a blend of two zone temperatures. This is why you profile with thermocouples, not just math.
A Worked Example
Let’s say you have a board that needs 3.75 to 4.5 minutes total time in the heated section. Your oven has 104 inches of effective heated length across 10 zones. Zone breakdown is roughly: 40 inches preheat, 60 inches soak, 24 inches reflow, and 32 inches cooling.
Starting with total dwell time:
104 inches divided by 4 minutes gives you 26 IPM as your initial belt speed.
Now zone by zone at 26 IPM:
| Zone | Effective Length (in) | Belt Speed (IPM) | Zone Dwell Time (min) |
|——|———————|——————|———————-|
| Preheat | 40 | 26 | 1.54 |
| Soak | 60 | 26 | 2.31 |
| Reflow | 24 | 26 | 0.92 |
| Cooling | 32 | 26 | 1.23 |
| Total | 156 | | 6.0 |
Wait, that total looks too high. The issue is I used gross zone lengths instead of the heated length that actually contributes to the thermal profile. Let me recalculate with just the 104 inches of effective heated length.
At 26 IPM, your board spends 4 minutes in the heated section. That’s within our target window. Now let’s see zone contributions more accurately:
| Zone | Effective Length (in) | Belt Speed (IPM) | Zone Dwell Time (min) |
|——|———————|——————|———————-|
| Preheat | 40 | 26 | 1.54 |
| Soak | 60 | 26 | 2.31 |
| Reflow | 24 | 26 | 0.92 |
| Cooling | 32 | 26 | 1.23 |
| Total Dwell | 156 | | 6.0 |
But we need to think about this differently. The preheat and soak zones heat the board. The reflow zone hits peak temperature. The cooling zone drops it. What matters is how long your board sits in each temperature band, not just the zone names.
At 26 IPM with 104 inches of heated length, total dwell is 4 minutes. The preheat zone contributes about 1.5 minutes, soak about 2.3 minutes, reflow under 1 minute, and cooling about 1.2 minutes. These add up to more than 4 minutes because zones overlap in their thermal effect.
Belt Speed vs Boards Per Hour
Belt speed alone does not tell you throughput. You also need to know board length, panel pitch, rail configuration, and where your line bottleneck sits.
The basic formula: boards per hour equals 3600 times belt speed times lanes, divided by panel pitch.
At 26 IPM on a single lane with a 13-inch panel pitch (10-inch board plus 3-inch spacing), you get roughly 116 boards per hour theoretically.
Real production? Plan for 70 to 90 boards per hour. That gap accounts for changeovers, loader limitations, availability losses, and the slowest machine in your line. Your upstream printer and placement machine will probably cap your actual throughput long before the oven does.
Expert Tip: A calculated speed gives you the starting point. Thermocouple profiling on actual product frequently shifts that speed by 10-15% or more. When I profile a new board, I usually run the first article at the calculated speed, attach TCs to the heaviest board in the worst-case thermal location, and then adjust. Large BGAs and heavy copper areas create thermal gradients that the math simply cannot predict. The only number that matters is what the board actually experiences.
Equipment like S&M Co. Ltd. reflow ovens work with these same calculation principles, though your specific numbers will vary based on product thermal mass, paste requirements, and oven configuration.
Why Calculation Is Only a Starting Point
Here’s what the math cannot account for. Your board’s actual thermal mass. Your copper distribution. How your specific components respond to heat.
A heavy 3mm board with dense copper pours will lag behind a thin, light board every time. Large BGA packages store heat differently than small 0402 resistors. This is why thermocouple profiling on your actual product is mandatory, not optional.
Your measured profile must verify:
- Ramp rate: 0.5 to 2.5 degrees C per second for most SAC305 pastes, with 1.0 to 1.5 preferred to minimize solder balling
- Soak duration: 20 to 120 seconds in the 140 to 170 degree C range
- Time above liquidus: 30 to 100 seconds for SAC305, with 45 to 60 preferred
- Peak temperature: 230 to 260 degrees C
- Cooling rate: 2 to 6 degrees C per second
These numbers come from your paste manufacturer. Indium Corporation specifies SAC305 baseline limits, but always check your specific paste product data sheet for exact values.
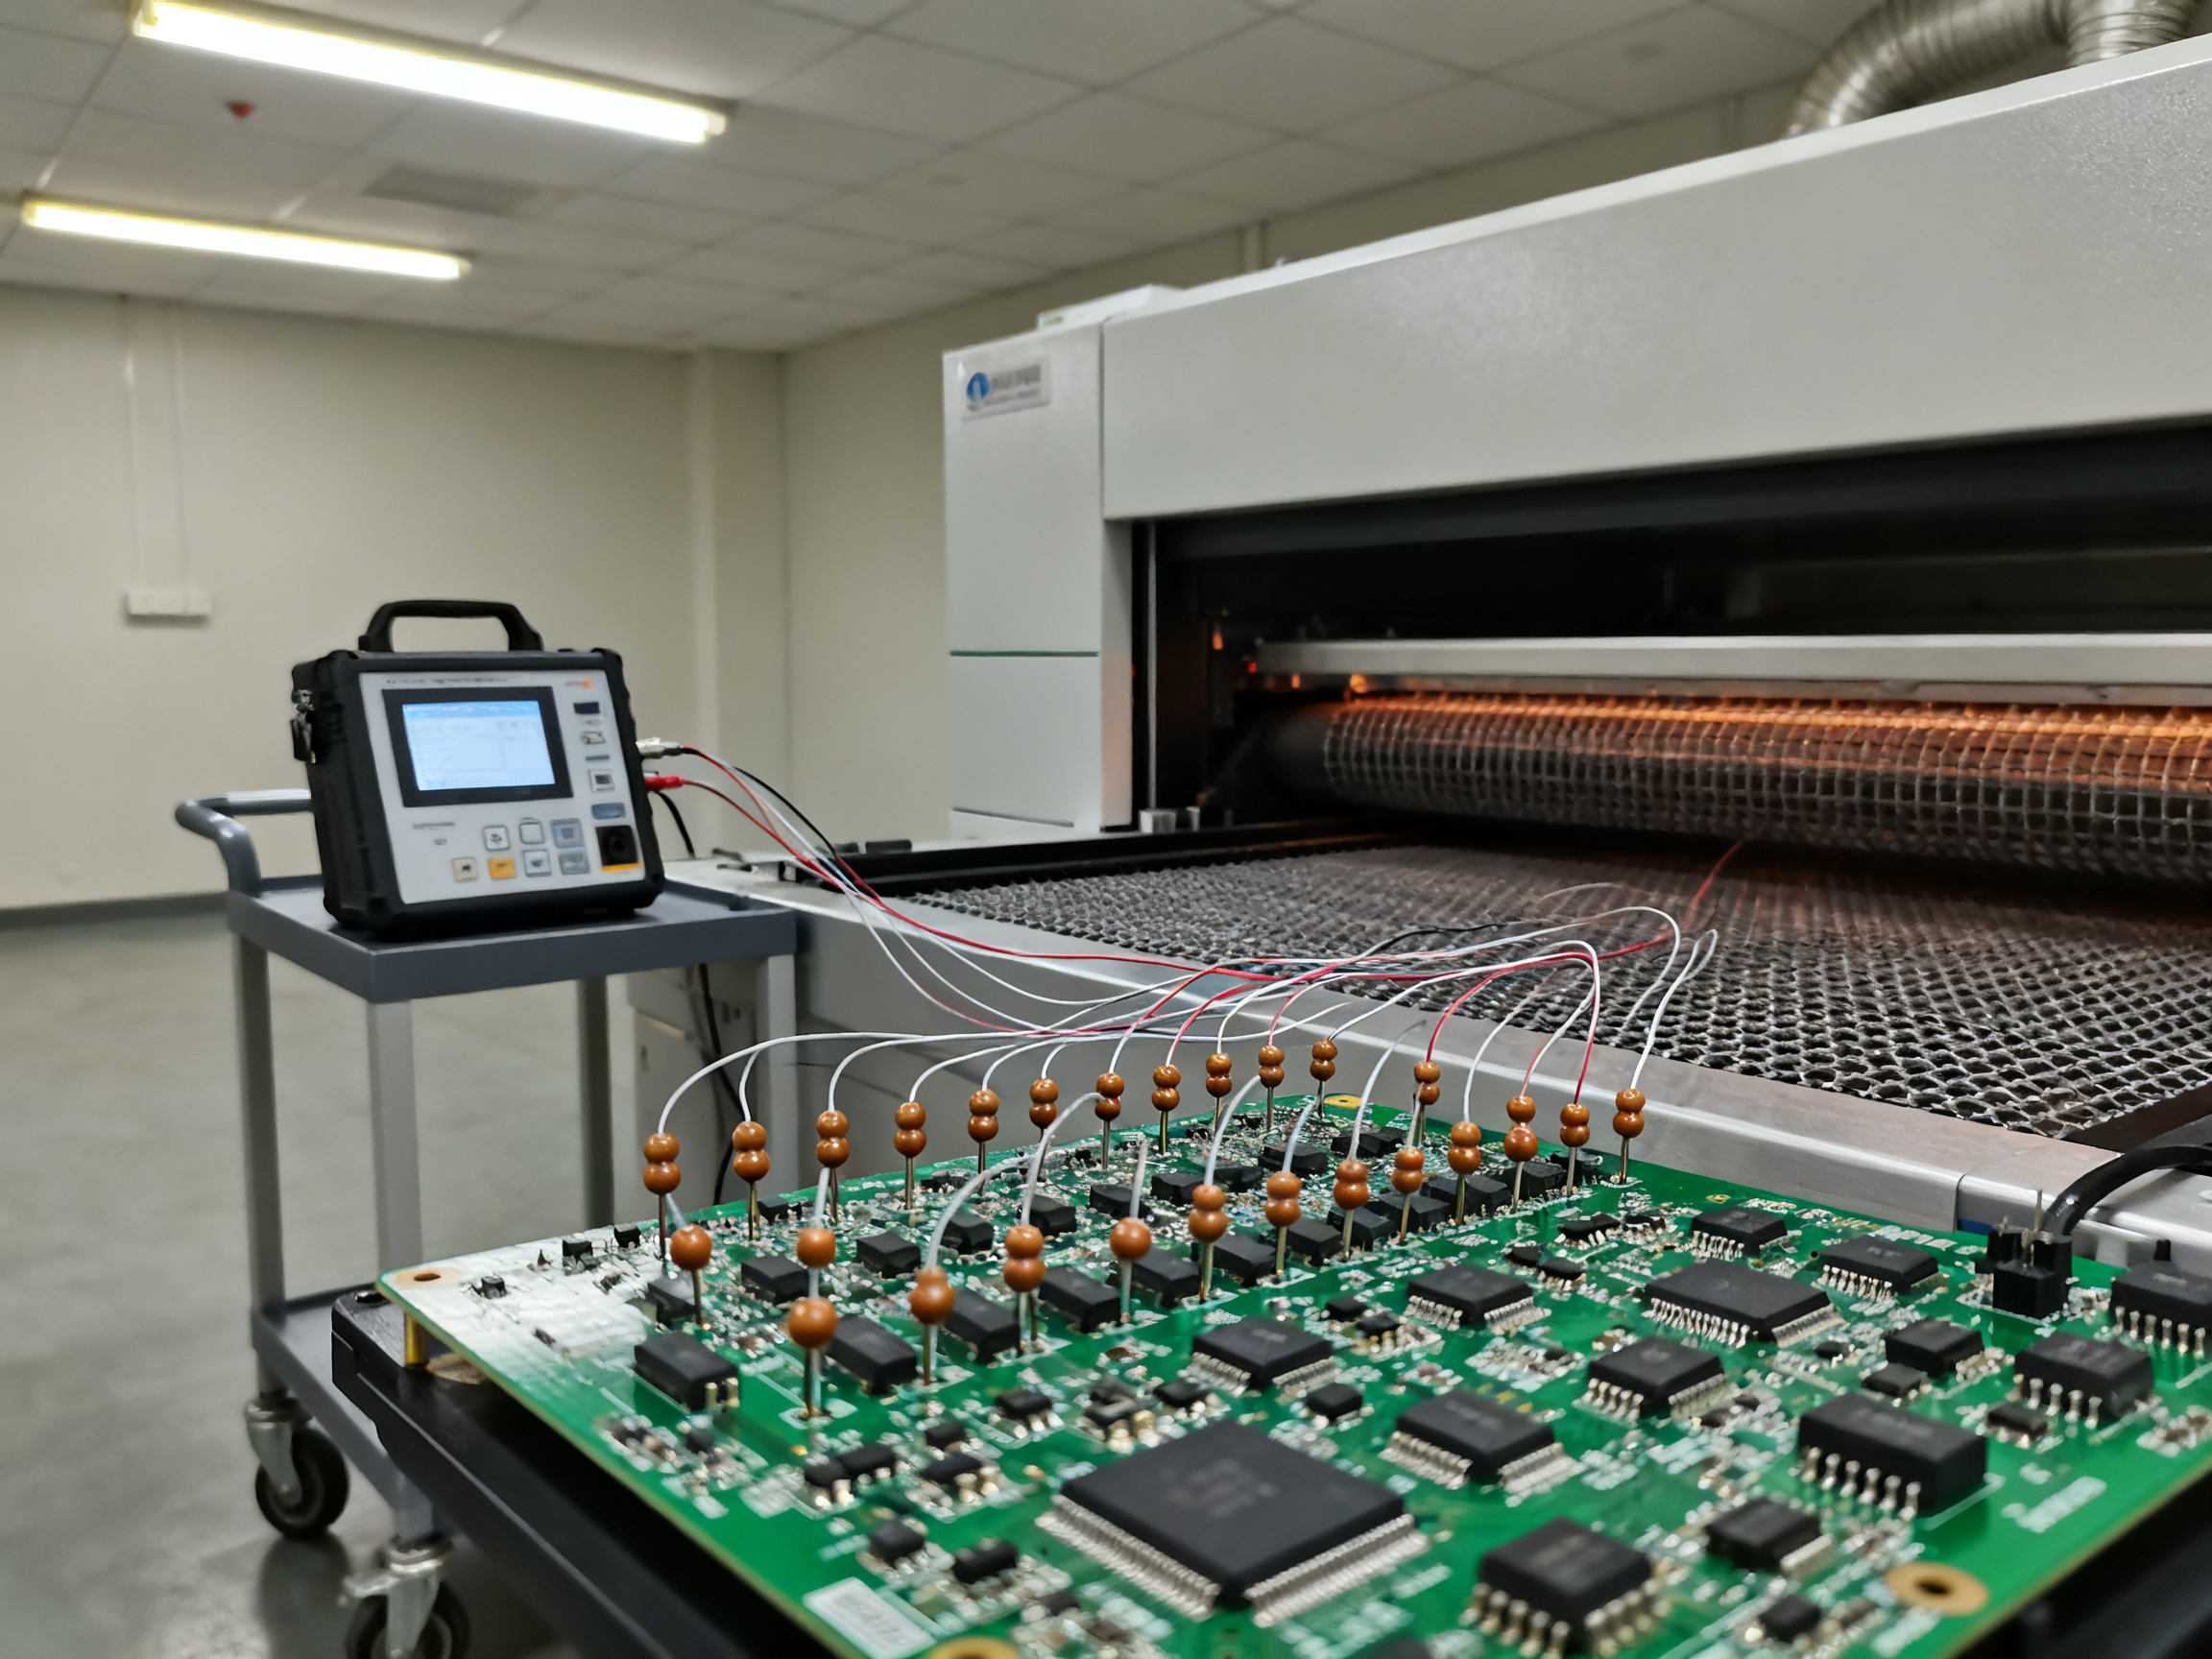
The thermocouples tell you what your board actually experiences at critical locations: BGA corner, center, and outer balls; QFN thermal pad and perimeter leads; the coldest and hottest spots on the board. IPC-7530A provides the profiling methodology. Your paste data sheet provides the acceptance limits. The two must agree.
Once your thermocouple data confirms the profile meets paste and component requirements, that belt speed becomes your production recipe. Then you can fine-tune zone temperatures to center the process window rather than just barely passing.
3. Translate Zone Timing Into a Valid Thermal Profile
Your calculated belt speed gives you a starting point. Now comes the part that actually matters: turning those zone dwell times into a thermal profile your board can actually survive.
What Each Zone Does
The preheat zone handles more than just warming up. Solvent in the solder paste needs to evaporate cleanly, and flux activators need time to prepare the metal surfaces. Rush this stage and the solvent flashes to steam, leaving you with solder balls scattered across the board. Go too slow and the flux burns off before it can do its job.
The soak zone equalizes temperatures across your board. Large components like BGAs store heat and lag behind smaller parts. A good soak brings everything to roughly the same temperature before reflow. It also gives the flux time to clean oxides off the pads and leads. Typical soak lasts 20 to 120 seconds in the 140 to 170 degree Celsius range.
The reflow zone is where peak temperature happens. Solder melts and wets the component leads and pads. Intermetallic compounds form immediately between the solder and metallizations. This is necessary, but too much time above liquidus causes excessive intermetallic growth that makes joints brittle.
The cooling zone solidifies the joint and sets the final grain structure. Cooling rate matters here. Too fast and you can stress the joint thermally. Too slow and you get coarse grain structures with too much intermetallic layer. Most paste manufacturers specify 2 to 6 degrees Celsius per second for best results.
Why Real Boards Create Hot and Cold Spots
Your calculated recipe assumes uniform heating. Real boards break that assumption constantly.
Copper distribution is the big one. Heavy copper pours near QFN thermal pads act as heat sinks. They pull energy away from nearby components and create cold spots. Small components next to large BGAs often run hotter because the BGA radiates heat upward.
Component shadowing plays a role too. Tall components block airflow from reaching parts behind them. Boards with mixed heights heat unevenly unless your oven airflow is strong enough to compensate.
Panelization matters. Boards in the center of a panel heat differently than those at the edges. Fixtures and carriers change the thermal dynamics. Product mix on the same belt means a light board and a heavy board going through together experience completely different profiles.
Key Profile Metrics to Track
Once your thermocouples collect data, compare these outputs against your paste manufacturer specifications:
| Metric | Typical Range (SAC305) | Target Range |
|——–|———————-|————–|
| Ramp rate | 0.5 to 2.5 C/s | 1.0 to 1.5 C/s |
| Soak interval | 20 to 120 seconds | 60 to 90 seconds |
| Time above liquidus | 30 to 100 seconds | 45 to 60 seconds |
| Peak temperature | 230 to 260 C | 235 to 250 C |
| Cooling rate | 2 to 6 C/s | 3 to 4 C/s |
Delta-T, the temperature spread between your hottest and coldest thermocouples, tells you how uniform the heating is. IPC-7530A guidelines suggest keeping delta-T as low as practical for your board. BGA assemblies particularly need tight control because the corner balls and center balls can see different temperatures.
Process Window Index (PWI) gives you a single number showing how much of your process window you are using. A PWI under 100 percent means all measurements fall within spec. But passing PWI does not guarantee a capable process. You still need to verify joint quality visually and with X-ray inspection for BGAs and QFNs.
When you see defects at inspection, the profile data points you toward root causes. Excessive ramp rate causes solder balling. Prolonged soak causes solder河西 and HiP defects. Insufficient time above liquidus creates non-wetting. Peak temperature too high risks component damage. Too low and you get incomplete reflow. Cooling rate problems cause cracks or excessive intermetallic growth.
From Our Experience: We have profiled boards where the math said everything was fine, but the actual thermocouple data showed a 15-degree difference between the BGA corner balls and center balls. The placement machine was putting the BGA on a large copper pad that acted as a heat sink. No formula accounts for that. You have to measure it.
This is why thermocouple profiling on your actual production board is mandatory, not optional. Your paste data sheet from Indium Corporation or your preferred supplier lists the exact limits. Your IPC-7530A profiling session captures what your board actually experiences. When those two things agree, you have a valid recipe.
4. Manage the Conveyor Reflow Oven Exit and Cooling Section
The moment your board crosses that exit threshold, the thermal story shifts. Solder transitions from liquid to solid. Residues from the flux stabilize. The assembly cools enough to handle, inspect, and move downstream. Get this right and your joints form properly without stress. Get it wrong and you introduce cracks, warpage, or safety hazards that no amount of downstream inspection can fix.
What Happens at the Exit
The cooling zone does the heavy lifting after reflow. Heat dissipates from the board, components, and solder joints. The rate at which this happens, your cooling rate, directly affects joint grain structure and reliability. Too fast and thermal shock creates microcracks. Too slow and you get coarse grain structures with excessive intermetallic growth.
Most SAC305 pastes want 2 to 4 degrees Celsius per second cooling. Some oven manuals suggest around 1 degree per second as a conservative target. Specialized systems like the Heller MK7 optional cooling package can exceed 6 degrees per second for high-mass assemblies, but that is equipment capability, not a universal recommendation. Your paste data sheet and measured profile should drive these settings, not blanket rules.
Cooling Zone Capacity and Setup
Air-cooled systems rely on forced convection from fans pushing ambient or chilled air across the board surface. Capacity depends on airflow volume, heat-exchanger condition, zone length, board mass, and copper distribution. Water-cooled heat exchangers handle this more consistently, especially for heavy copper boards or high-throughput lines. If you run nitrogen, that atmosphere affects cooling dynamics too.
Conveyor extension matters more than most people realize. Your board needs continuous support through the hot-to-cool transition. A gap or unsupported edge creates flex that stresses newly formed joints. Rail alignment, width datum, and orientation must match what the downstream equipment expects. Verify transfer height compatibility before you run production.
The Exit Temperature Reality
Here is where things get practical. No universal “safe exit temperature” exists. Your AOI equipment has specifications. Your downstream handlers have limits. Your operators have safety concerns. And if boards exit above the dew point, condensation becomes a moisture problem waiting to happen.
Test your actual exit temperature with a thermocouple on a fully loaded board. Then check whether your downstream equipment can handle that temperature. If boards come out at 80 degrees Celsius and your AOI struggles, you might need a longer cooling zone, more aggressive airflow, or a conveyor extension that gives extra time before transfer.
Pro Insight: We learned this the hard way on a heavy copper automotive board. Boards looked fine at the oven exit but warped noticeably by the time they reached AOI, about 3 meters downstream. The root cause was insufficient cooling before transfer combined with thermal mass that kept the board warping as it cooled on the wrong surface. Adding a conveyor extension and adjusting the cooling zone fan speed eliminated the issue. The fix had nothing to do with zone temperatures and everything to do with how we managed the board after it left the heated section.
Hermes and SMEMA handshakes at the exit need validation too. Test complete board transfer transactions including board ID, dimensions, conveyor direction, routing, and downstream readiness. Verify this works at your minimum and maximum board dimensions and at different belt speeds.
S&M Co. Ltd. reflow ovens include configurable cooling zones and conveyor extensions that support these downstream compatibility requirements, helping you match exit conditions to your specific production flow.
5. What Conveyor Reflow Oven Size and Configuration Do You Need?
Sizing a reflow oven feels straightforward until you start plugging in real numbers. Most buyers focus on zone count, but that misses the point. What you actually need is an oven that fits your product mix, your throughput targets, and your quality requirements without花钱花得太狠 or leaving you with constant firefighting.
Here’s how to build your requirements list the right way.
Start With Your Product and Process Data
Before you talk to any oven vendor, document what you’re actually running. This sounds obvious, but shops skip this constantly and then wonder why the oven they bought doesn’t work for their real production.
Gather these specifics:
- Maximum PCB dimensions in length, width, and thickness
- Component height clearance requirements
- Board mass and copper density (this affects thermal load big time)
- Your paste alloy and profile requirements
- Whether you need nitrogen atmosphere or air processing
- Product mix: single board or lots of variations
- Traceability requirements from your customers
- Uptime target: what percentage of scheduled time must the line run
- Applicable quality standards: IPC-J-STD-001, IATF 16949 for automotive, AS9100 for aerospace
Write all of this down. When you send it to vendors, you’ll get much better quotes.
Sizing the Oven for Realistic Throughput
Most oven specs list theoretical throughput. The real number is always lower.
Your effective capacity depends on boards per hour, panel pitch, usable conveyor width, realistic changeover time, availability losses, and whatever your slowest upstream or downstream machine is. If your placement machine can only handle 80 boards per hour, no reflow oven will magically make that 120.
The formula gives you a starting point: multiply your required throughput by the cycle time per board. But always add margin for availability losses, changeovers, and warm-up periods.
Here’s the thing about zone count and heated length. More zones and longer heated sections help when you need a wider process window, not just when you need more throughput. A board with heavy copper and large BGAs benefits from extra soak time at a given belt speed. That means more zones let you run faster while still hitting your thermal targets. But if you’re running simple, thermally uniform boards, extra zones just give you adjustment range you never use.
| Complexity Level | Board Size | Throughput Target | Typical Zone Count | Heated Length | Atmosphere |
|——————|————|——————-|——————-|—————|————|
| Low | Up to 12″ x 12″ | Under 100 BPH | 6 to 8 zones | 48″ to 64″ | Air |
| Medium | Up to 18″ x 14″ | 100 to 180 BPH | 8 to 10 zones | 72″ to 96″ | Air or N2 |
| High | Up to 24″ x 18″ | 180+ BPH | 10 to 14 zones | 96″ to 144″ | N2 with low O2 |
Comparing Configurations Across Sectors
Consumer electronics buyers care most about volume, changeover speed, and cost per board. They want ovens that run fast with minimal downtime between product switches.
Semiconductor-related assemblies need tight thermal uniformity and warpage control. These buyers prioritize oven-to-oven repeatability over raw speed.
Automotive production requires IATF 16949 alignment, locked recipes that operators cannot change, and complete traceability. Every board’s thermal profile gets logged.
Military and aerospace work depends on contract-specific workmanship standards. Configuration control matters more than optimization. You document what you validated and you run exactly that.
From Our Experience: We spec’d an oven for a mixed-product line running everything from simple single-layer boards to complex 12-layer automotive modules. The temptation was to buy the biggest, most zones available. Instead, we sized for the heavy boards and used the extra zones to run simpler products faster. The flexibility paid off when product mix shifted quarterly. A smaller oven would have locked us into slow speeds on our worst-case product.
Building Your RFQ Checklist
When you’re ready to request quotes, include these items:
- Maximum board envelope you need to run
- Minimum and maximum panel pitch
- Rail width adjustment range
- Required conveyor configuration (single lane, dual lane, rail-only)
- Atmosphere requirements (air, nitrogen, oxygen level target)
- Cooling requirements
- Utilities: voltage, phase, BTU/hr exhaust, nitrogen flow capacity
- Protocol support: SMEMA, Hermes, IPC-CFX
- Data logging and traceability features
- Calibration support and documentation
- Service coverage in your region
- Expansion margin for future product needs
Getting clear on these points before you talk to vendors saves everyone time. It also means the quotes you get actually match what you need, not what the salesperson thinks you need.
Equipment from S&M Co. Ltd. reflow ovens comes configured for these requirements, with modular zone packages and communication protocol support that scales from basic SMEMA to full IPC-CFX traceability depending on your quality system needs.
6. How Conveyor Reflow Ovens Are Made and Which Parts Matter
Think about what happens inside your oven every shift. The frame takes the load. The tunnel traps heat. The conveyor moves boards. Everything has to work together or your profile falls apart.
What Actually Gets Built
A conveyor reflow oven starts with a welded rigid frame, usually stainless steel. Adjustable feet let you level everything on an uneven shop floor. Double-wall construction with low-emission insulation keeps heat where it belongs and protects workers from burns.
Inside the tunnel, you’ll find modular heating zones stacked together. Each zone contains its own heater bank, blower motor, and plenum. Upper and lower plenums push hot air across the board from both sides. Zone-to-zone seals stop heat from short-circuiting backward. Removable covers let technicians access everything for cleaning and repair.
The conveyor system uses either stainless steel mesh or dual rails depending on board size. Motorized width adjustment slides the rails to center different board sizes. Center supports catch heavy panels before they sag. Chain or mesh retention handles thermal expansion without derailing.
Sensors sit everywhere: temperature sensors in each zone, over-temperature protection sensors, board-detection sensors, conveyor-position encoders. The controller ties it all together with a PLC and touchscreen interface.
Build Quality Equals Process Control
Poor build quality shows up fast in your production numbers. Uneven rail alignment creates board skew and edge collisions. Worn blower bearings introduce vibration that dislodges components. Heater elements that cannot recover after a board passes create profile drift throughout a shift.
You need to verify key specs during procurement:
| Component | Failure Mode | Detection Method | Risk Level |
|———–|————-|——————|————|
| Heater banks | Uneven heating, drift | Thermal profiling | High |
| Blower motors | Reduced airflow | Temperature spread | High |
| Rail alignment | Board skew, jams | Visual inspection | Medium |
| Over-temp protection | Safety risk | Manual test | Critical |
| Conveyor speed | Profile shape | Tachometer check | High |
| Insulation | Heat loss, external temp | IR camera | Medium |
Rail parallelism across full travel distance matters. Conveyor speed accuracy needs testing with a calibrated tachometer at minimum, normal, and maximum settings. Cross-belt temperature uniformity gets mapped across the tunnel width. Independent over-temperature protection must cut power if temperatures exceed safe limits.
Most buyers focus on zone count. They miss the stuff that actually affects uptime. Ask about mean time between failures for blower motors and heater banks. Check spare parts availability and lead times. Verify that calibration certificates come traceable to national standards.
Equipment from S&M Co. Ltd. gets built with these service considerations in mind, using standardized components where possible and providing documentation that supports quality system alignment for automotive and aerospace customers.
The critical over-temperature protection needs verification at every preventive maintenance interval. Everything else you can work around if you catch it early enough.
7. Profile, Validate, and Troubleshoot the Production Recipe
So you have your calculated belt speed, your zone temperatures are set, and you ran a board through. Now comes the part most guides skip: proving your recipe actually works, locking it down so nobody changes it accidentally, and knowing what to fix when something goes wrong.
A Controlled Profiling Workflow
Follow this sequence every time you develop or change a recipe:
-
Confirm paste requirements first. Grab your solder paste data sheet and write down the exact limits for ramp rate, soak window, time above liquidus, peak temperature, and cooling rate. Indium Corporation and other manufacturers publish these numbers. They are not suggestions.
-
Select a representative test vehicle. Profile your worst-case board thermally, not just the most expensive one. That means the heaviest board, the one with the most copper, the BGA-heavy design. If it passes, lighter boards will too.
-
Attach thermocouples at critical locations. BGA corner balls and center balls. QFN thermal pad and perimeter leads. Board center and edges. Anywhere you have seen defects before. Use the smallest practical bead and strain-relieve the wires.
-
Run at steady state with realistic loading. One board through an empty oven does not tell you anything. Run with product on both lanes if applicable.
-
Analyze results against paste limits and component maximums. Check every thermocouple trace, not just the worst one.
-
Adjust ONE variable at a time. If speed needs changing, change speed first. Then re-profile. Do not touch zone temperatures and belt speed simultaneously.
-
Lock the approved recipe. Document everything. Save it with a version number.
Decision Tree: From Symptom to Root Cause
When defects show up at AOI, do not guess. Start with profile data.
Solder balls or scatter? Check ramp rate. Too fast and solvent flashes, creating splatter. Also verify paste age and printing.
Cold joints or non-wetting? Verify peak temperature and time above liquidus. Insufficient heat means insufficient wetting force.
Tombstoning? Look at soak and ramp. Uneven heating between component sides causes lifting. Check pad design and paste coverage too.
BGA voiding? Soak profile matters most. Insufficient flux activation and volatile entrapment create voids. Also verify component placement and paste printing.
Head-in-pillow? This one is tricky. Often a combination of BGA warpage, insufficient soak, and solder oxidation. Profile the BGA body temperature specifically, not just nearby locations.
Board warpage? Check peak temperature and cooling rate. Too much heat or too-fast cooling stresses the laminate. Also verify board support through the cooling zone.
Validation Record Template
Your documentation should capture:
| Field | What to Record |
|——-|—————-|
| Board revision | Exact version profiled |
| Paste lot | Manufacturer, product, lot number |
| Thermocouple locations | Diagram with coordinates |
| Oven recipe | Zone temps, belt speed, atmosphere |
| Profile results | All TCs, PWI, delta-T |
| Inspection results | Visual and X-ray findings |
| Approval | Name, date, signature |
From Our Experience: We had a situation where profiling looked perfect for weeks. Then a new paste lot came in and we started seeing intermittent HiP defects. The paste lot difference was subtle, well within spec on paper, but enough to shift our process window. We now require first-article inspection on every new paste lot, not just every new board design. That one change probably saved us two costly escapes to the field.
Ongoing Controls
Your job is not done when the recipe is locked. Set up these controls:
First-article verification on every new board revision or paste lot. Same profiling sequence, same documentation.
Periodic profiling on a schedule tied to risk. High-reliability automotive or aerospace gets tighter intervals. Consumer boards can stretch further.
Conveyor speed verification monthly with a calibrated tachometer. The displayed number can drift.
Sensor calibration per your quality system requirements. Trace to national standards.
Preventive maintenance on blowers, heaters, and rails. Worn components cause profile drift.
Recipe access control. Operators should run approved recipes, not tweak zones when something looks off. That is what engineering is for.
Statistical monitoring of profile variables over time. Track peak, TAL, cooling rate, and PWI. When trends drift toward limits, investigate before you make bad boards.
Change management for anything that affects thermal performance. New paste formulation. Different board thickness. Major maintenance. All require revalidation.
A Real Example
Here is what this looked like in practice. We profiled a 12-layer automotive module with heavy copper pours near several QFNs. First article showed a 12-degree delta-T across the board, with the thermal pad running cold. We added a preheat zone extension, increased belt speed slightly to reduce total time, and re-profiled. Second article showed delta-T under 4 degrees. Throughput improved. First-pass yield went from 87 percent to 96 percent. The fix took three profiling cycles and about two weeks, but the process has been stable ever since.
The lesson: math gets you close. Thermocouples tell you the truth. Patience during validation pays off in the long run.
Introduction
Welcome to our comprehensive guide on Effective Content Strategy. In this article, we explore proven techniques to engage your audience and boost your site’s visibility.
Why Content Strategy Matters
- Audience Alignment: Understanding what your readers need.
- SEO Impact: Leveraging keywords to improve search rankings.
- Brand Voice: Maintaining consistency across all platforms.
Stay tuned as we dive deeper into each of these areas in the sections that follow.
Set Speed From the Profile, Then Prove It Under Production Conditions
The math gets you close. Instrumented profiling with thermocouples tells you the truth.
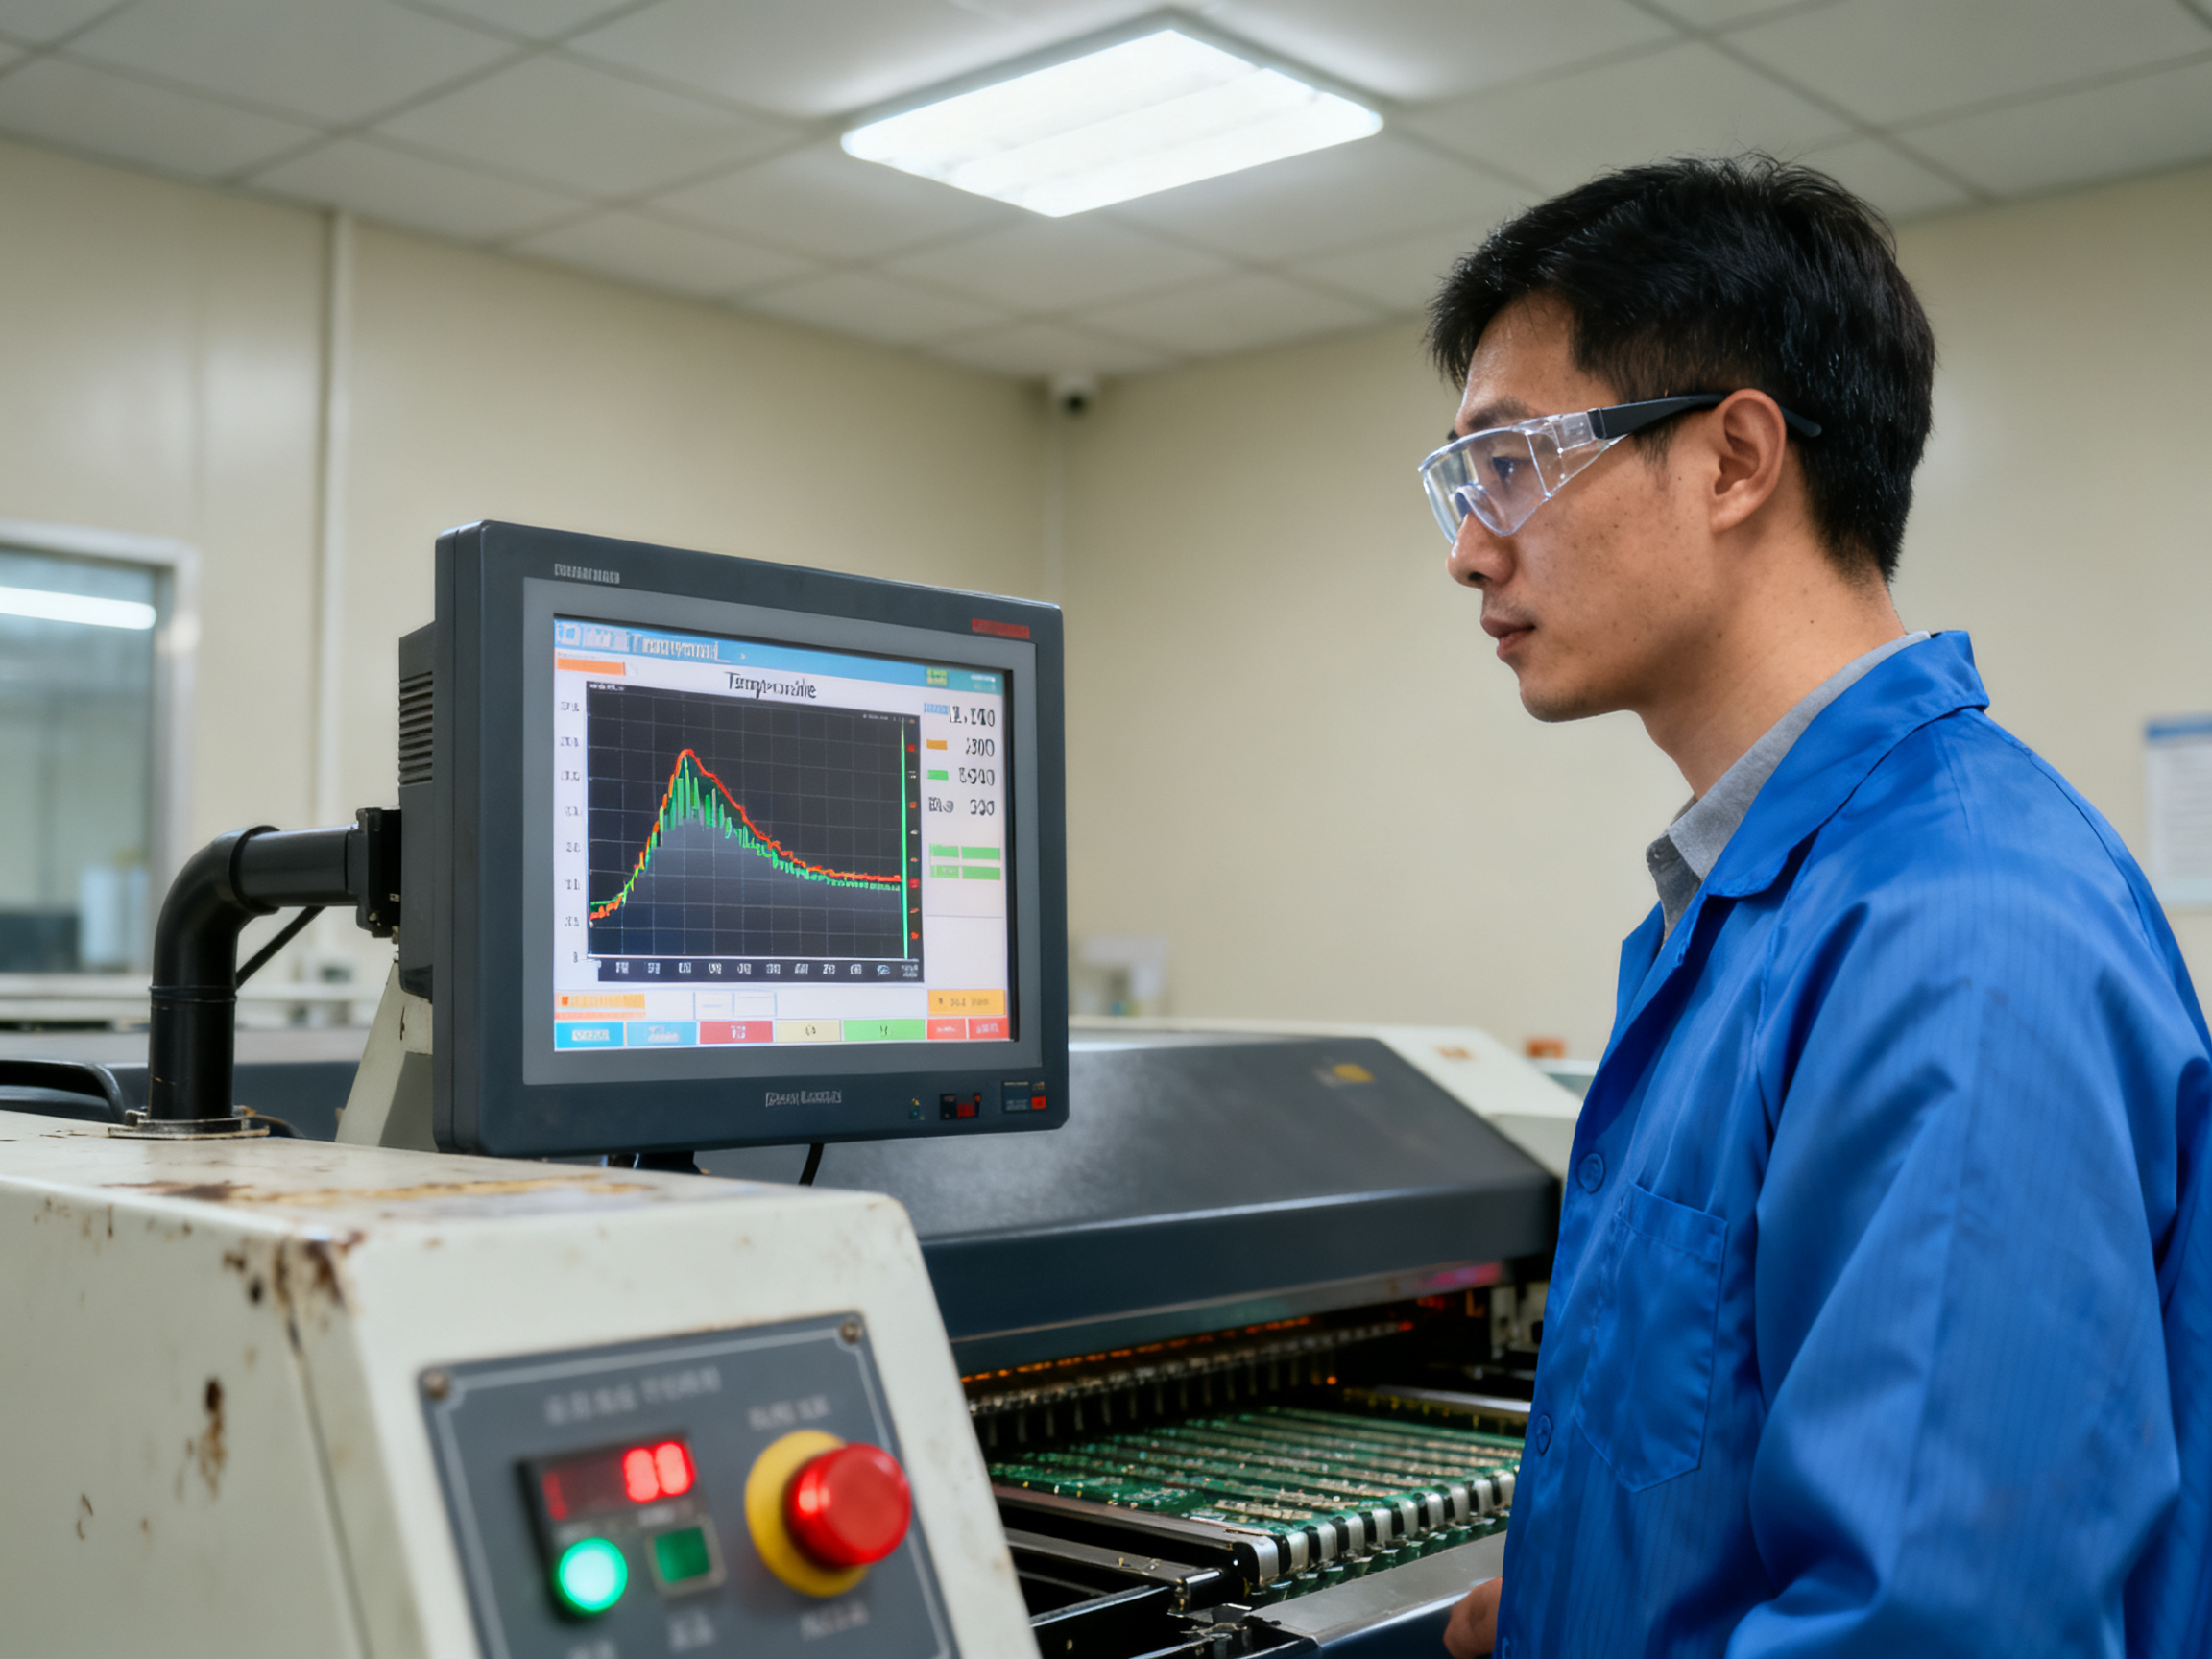
Your conveyor speed calculation, using effective heated length and target residence time, provides a solid starting point. But that number stays theoretical until you attach thermocouples to your actual board, run it at steady-state production loading, and verify every critical measurement falls within your paste manufacturer limits. Only then does a belt speed become a qualified production recipe.
Follow this sequence every time: gather board thermal mass data and paste profile requirements first. Calculate your initial speed. Run thermocouples at worst-case board locations. Adjust based on measured results, not guesses. Verify exit handling compatibility with downstream equipment. Document the approved window. Set up drift monitoring for ongoing control.
When you select your next reflow oven, focus on validated process capability for your product mix, realistic throughput under your actual production conditions, supplier support responsiveness in your region, compliance with your quality standards, and total cost of ownership over five years. Zone count, maximum speed ratings, and purchase price alone tell you almost nothing about whether that oven will work for your products.
Action Checklist
- Gather paste data sheet limits and board thermal mass specifications
- Calculate initial belt speed from effective heated length and target dwell time
- Attach thermocouples to worst-case thermal locations on actual production boards
- Profile at steady state with representative loading
- Verify all measurements against paste manufacturer acceptance criteria
- Test exit temperature against downstream equipment specifications
- Document approved recipe with version control
- Implement conveyor speed verification schedule
- Set up statistical monitoring for profile drift
- Review supplier support agreements and spare parts availability
References and Methodology
This guide references IPC-7530A for temperature profiling methodology, IPC J-STD-001 requirements where applicable, and solder paste technical data sheets from major manufacturers including Indium Corporation. All thermal profile acceptance criteria should come from your specific paste product data sheet and your applicable quality standards. Verify that your profiler calibration is traceable to national standards and that your thermocouple attachment methods match IPC-7530A guidance. For automotive or aerospace production, ensure your quality system documentation meets the requirements of IATF 16949 or AS9100 as appropriate.