
Published: 22 October 2026
Reading Time: 17 minutes
Reviewer: Simon Scrapes, Founder
Introduction: Why Reflow Failures Are Expensive, and Why Most Factories Diagnose Them Wrong
There’s a specific moment in every production story that goes like this. A customer calls, says the field failures are climbing, and the whole line points fingers at the reflow oven. Replacements happen. Paste changes happen. Sometimes the paste change works by accident. But here’s the thing I watched happen on one customer line in Shenzhen, running roughly 2,000 boards a day for a smartphone assembly program: three engineers had already swapped the solder paste twice before anyone picked up a thermometer.
The fault was a heater thermocouple that had drifted. Not a component problem. Not a bad paste lot. A sensor reading 11 °C below reality, which meant the oven was quietly running hot in one zone. Their AOI was clean. Their SPI was clean. The boards failed downstream at functional test, and every conversation pointed at “the oven.”
We pulled the profile and compared it against the oven’s own reported curve. That’s when the gap showed up. The oven said 235 °C peak. The board was actually taking 248 °C. Nobody had checked, because the oven software was trusted like a weather report from a phone app. Fixing the thermocouple fixed the defect rate in one afternoon.
That story is why this article exists. Because the diagnostic method, not the diagnosis, is what determines whether you actually measure the problem.
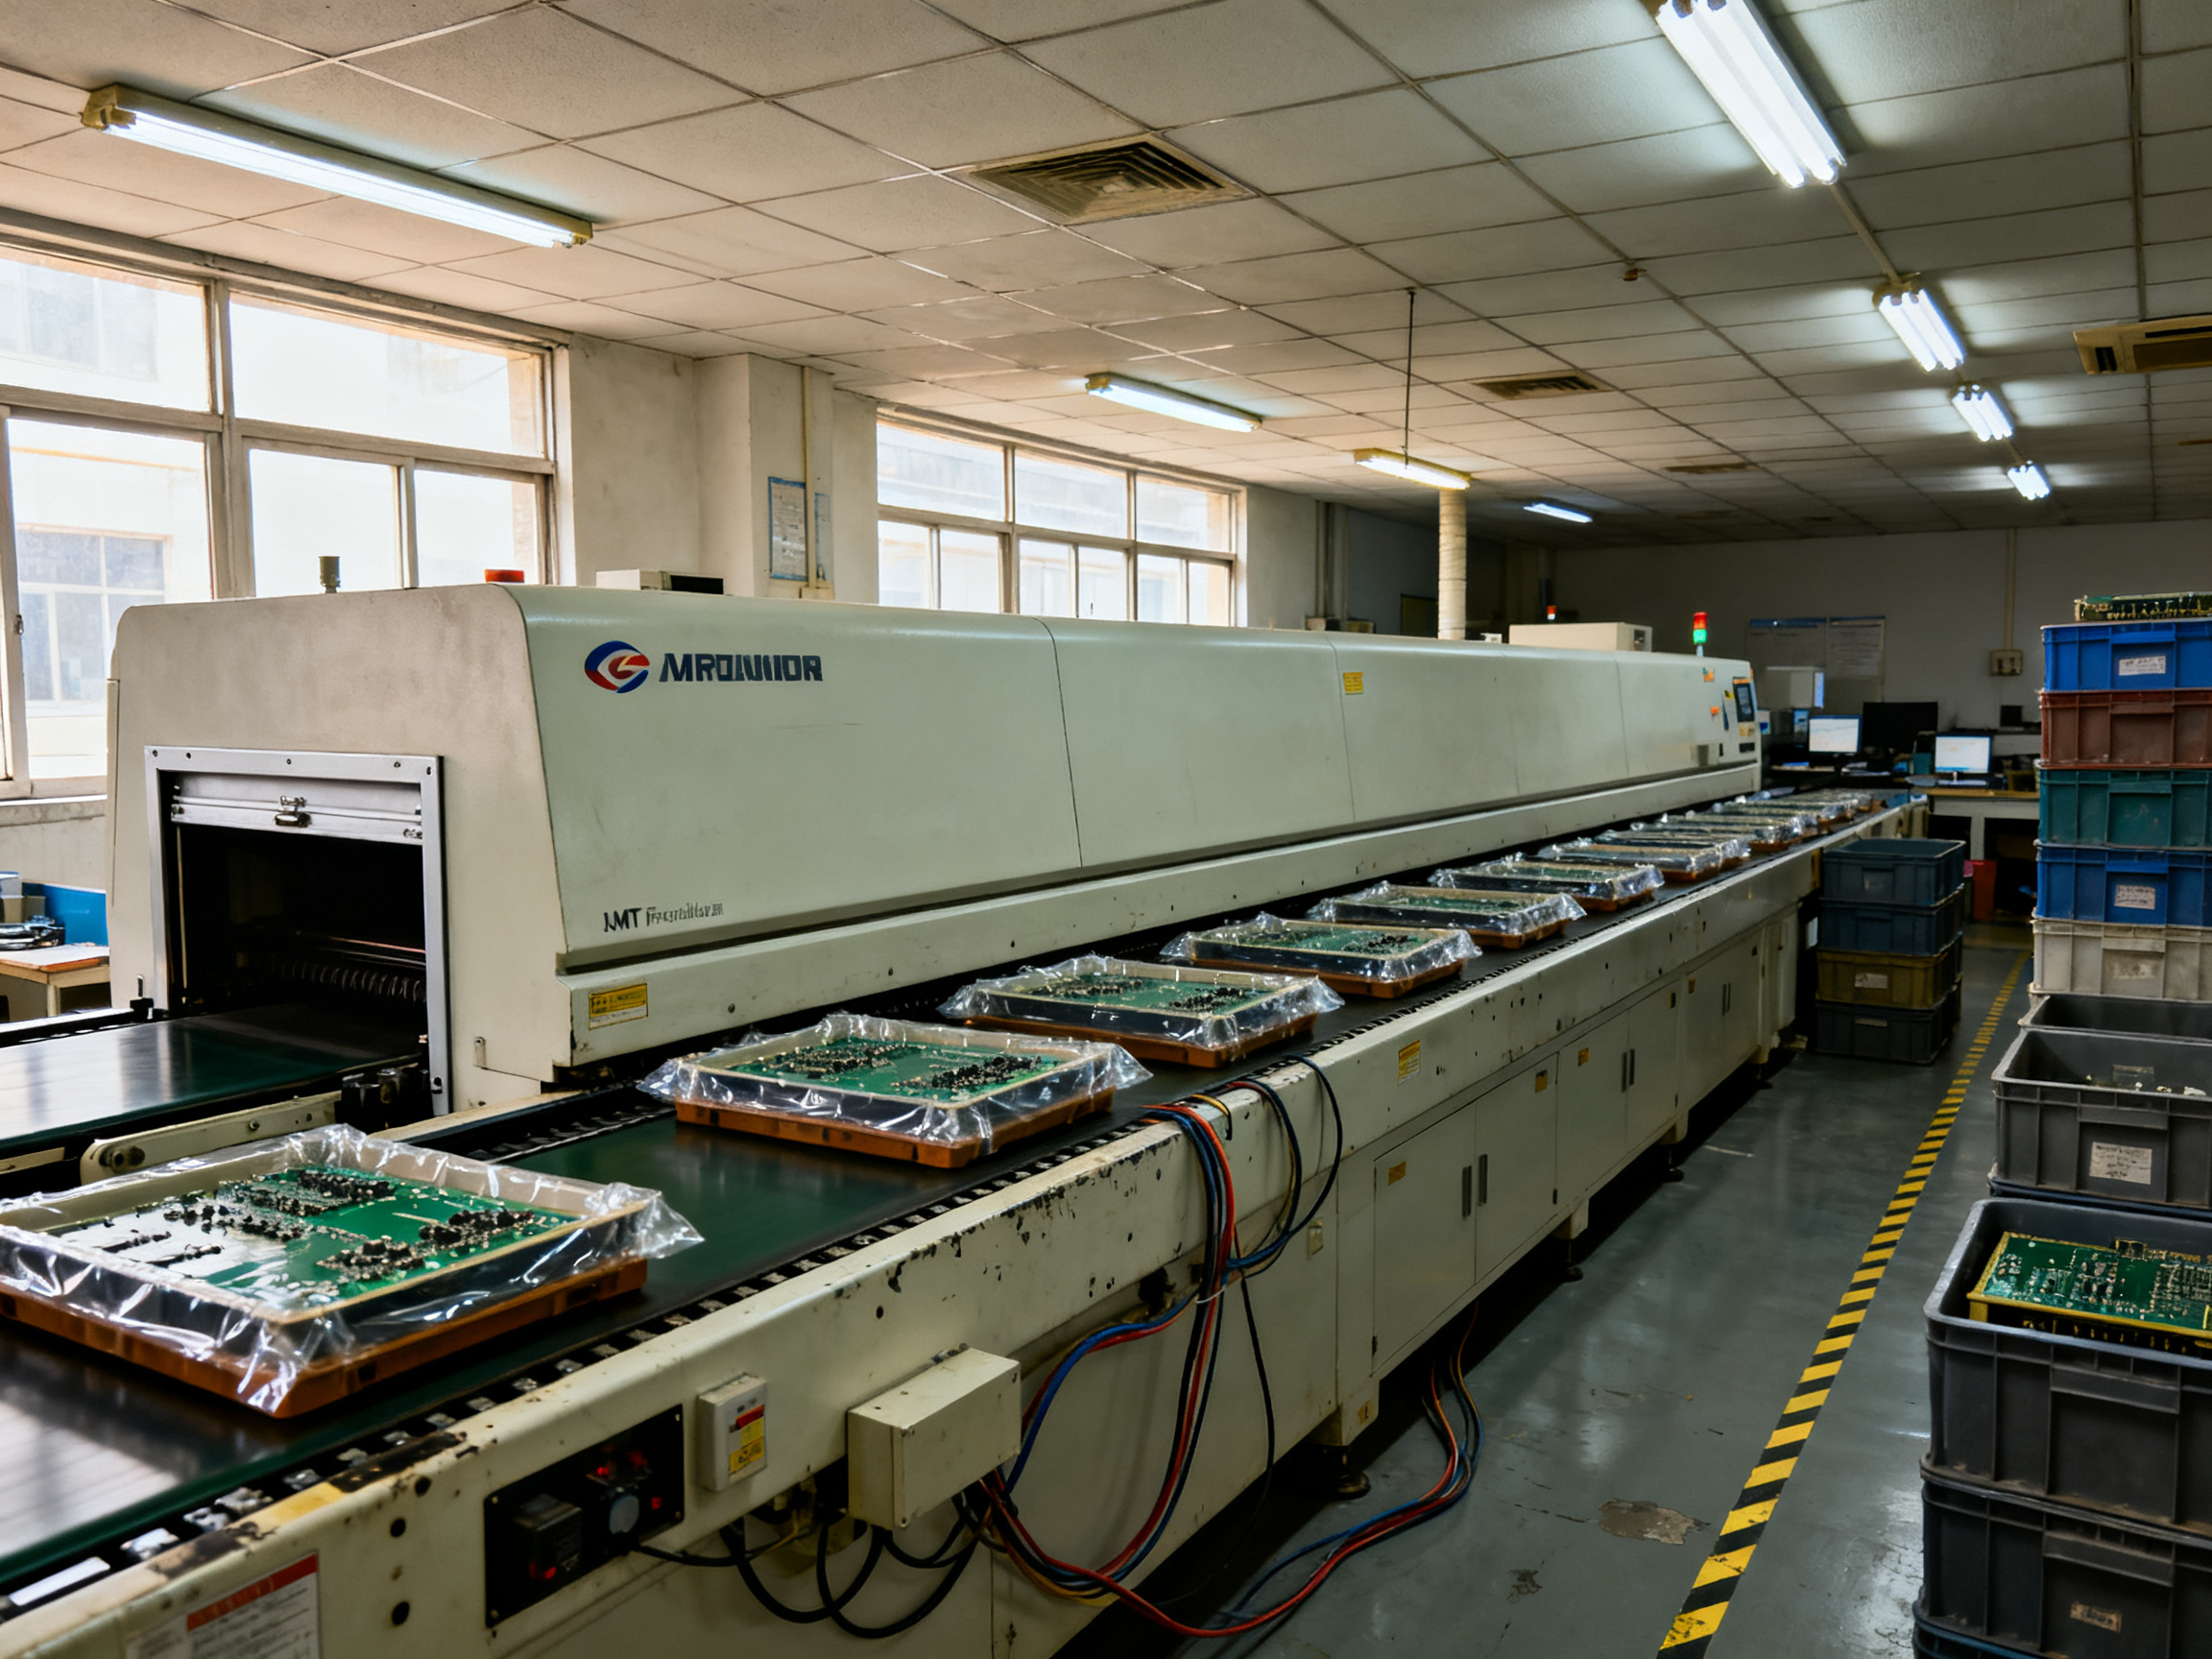
The cost reality nobody budgets for
Let’s get the money part out of the way first, because it decides how much tooling your line deserves.
Rework costs climb steeply the further downstream a defect travels. A printing defect caught at the stencil step costs pennies to fix. The same defect found at functional test lands around $20 to $40 per board in consumer electronics rework, and general PCBA rework is commonly budgeted at about $20 per board. BGA localized rework runs $50 to $150 in labour alone. For medical, aerospace, and high-value assemblies, rework commonly exceeds $100 per board.
And that’s before the hidden multiplier. Military and aerospace programs carry serialized traceability, environmental screening, test fixtures, documentation, and schedule impact. A scrapped board there can cost multiples of the board itself. The financial model that actually holds up in an audit looks like this: total cost per defect equals diagnosis plus labour plus materials plus retest plus delay plus yield opportunity plus scrap value. Diagnostic cost is the smallest line on that sheet. It’s also the only one that shrinks every future defect, not just the current one.
On yield figures, be careful, because the numbers online are noisier than they look. Mature high-volume consumer SMT lines are commonly benchmarked at roughly 98.5 to 99.5% board-level first-pass yield, but that’s a practitioner benchmark, not an IPC statistic. For high-reliability aerospace and Class 3 production, 99% or higher is the usual target. Nowhere in the public 2026 evidence is there a defensible industry-wide percentage for first-pass-yield loss caused specifically by solder-joint defects. If someone quotes you “80% industry average,” they made it up.
One measurement note worth internalizing: first-pass yield can mean board FPY, defect FPY per joint, test FPY after ICT or flying probe, or rolled-throughput yield after rework. A board can contain a defect that AOI caught, get reworked, and then vanish from your shipment statistics. So the defect rate you measure is often lower than the defect rate you shipped. Practitioners who track FPY definition and rework policy tend to catch this faster than those who don’t (how CMS judgement depends on FPY definition).
Stat box: What a reflow defect actually costs
- Printing-stage correction: cents per board
- Defect found at functional test: roughly $20 to $40 per board
- BGA localized rework: $50 to $150 in labour
- Medical, aerospace, and military assemblies: $100+ per board, before scrap and schedule impact
- Mature consumer SMT board FPY: ~98.5 to 99.5% (practitioner benchmark, not an industry standard)
- Rule of thumb: a diagnostic tool pays for itself in the first month it catches a recurring profile error
The three-cause frame that makes diagnosis possible
Here is the mental model that runs through this entire article. A reflow defect comes from one of three places:
- The thermal profile. Ramp rate, soak time, time above liquidus, peak temperature, or cooling is wrong for the board, the paste, or the components.
- The material or the board. Paste, pad finish, warpage, copper distribution, board construction, or component design.
- The machine. Heater element, thermocouple, fan, conveyor, exhaust, atmosphere, or the control software reading its sensors wrong.
And here’s the trap most lines fall into: they skip straight to cause number three. They buy a new oven, swap a thermocouple, replace a fan, and hope. Meanwhile, if the real cause was the profile window set for a different paste alloy, no amount of hardware work fixes it.
The diagnostic method is what tells you which of the three you’re actually measuring. That’s why the order in this article is deliberate: tools first, then software, then method, then the maintenance routine that keeps the answer from changing. Skip the method and you buy the wrong tool. Skip the maintenance routine and your careful diagnosis expires in six months.
What this article covers
No catalogue of shiny boxes. Instead you’ll get:
- The diagnostic toolkit, separating what a $200 calibrated thermocouple and logger catches from what a $15,000 thermal profiler catches, and when the cheap tool wins
- What reflow oven control software actually tells you, including the gap between the oven’s reported curve and reality
- A step-by-step method for how to diagnose reflow oven temperature issues, built around swap tests, soak-first logic, and a ten-minute board-mass sanity check
- A line-ready reflow oven maintenance checklist with real intervals
- The documentation standard, including J-STD-020F, IPC-7530, and what an aerospace auditor actually asks for
If you’re the one running the line, jump to Section 5 first and work backwards. If you’re building a capability from zero, start here.
Watch this first: a two-minute walkthrough of downloading and reviewing a thermal profile, which is the exact loop this article teaches you to repeat.
Reflow Oven Troubleshooting: The Tools, Software, and Diagnostic Methods That Find Real Defects
About the Author
Photo: [Author Name]
Role: [Role], Shenzhen Chuxin Electronic Equipment Co. Ltd. (S&M Co. Ltd.)
Focus areas: lead-free reflow profiling, thermal process control, BGA/QFN defect analysis
Reviewed by: [Named SMT process engineer, to be assigned]
[Author Name] is [Role] at Shenzhen Chuxin Electronic Equipment Co. Ltd. (S&M Co. Ltd.), where [X years] of hands-on work with lead-free reflow ovens, wave soldering systems, and full SMT production lines has shaped the company’s approach to defect prevention. That work includes thermal profiling and failure analysis for consumer electronics, semiconductor, and military-grade assembly lines, plus qualification support for BGA and QFN processes on customer sites.
Our editorial standard for this guide: every diagnostic step below is tied to a published IPC, J-STD-001, J-STD-020, or IPC-7351 reference wherever one applies. Where a step comes from vendor-specific test data or S&M field practice rather than a standard, it is labelled that way instead of being dressed up as one.
Related reading from S&M:
- Lead-free reflow oven selection: matching convection and infrared heating to your board mix
- Wave soldering defect guide: bridging, insufficient wetting, and solder skips explained
- Full SMT line integration: printers, SPI, placement, reflow, and AOI working together
- BGA and QFN X-ray defect analysis for high-reliability assemblies
Section 1: The Reflow Diagnostic Model, Four Layers of Failure Before You Touch the Machine
Most troubleshooting guides start at the machine. The oven runs hot, so you swap the oven. That’s backwards.
Before anyone opens a panel, work down a stack. A reflow defect almost always lives in one of four layers, and each layer leaves behind a signature you can learn to read.
Layer 1: Material, PCB and stencil. Paste alloy, pad finish, board construction, copper distribution, stencil aperture design, and solder paste volume. Failures here usually repeat on the same component family or the same pad geometry, which is a big clue.
Layer 2: Component placement and paste printing. Offset placements, tombstoning risk from placement force, insufficient or excessive deposit volume, skip and streak defects from the stencil. The defect count tracks with a specific feeder, a specific paste lot, or a specific board revision.
Layer 3: Thermal profile. Ramp rate, soak time, time above liquidus, peak temperature, and cooling rate. This is where a lead-free reflow profile gets judged, and where most lines guess rather than measure.
Layer 4: Machine and mechanical. Heater elements, thermocouples, fans, conveyor speed and chain tension, exhaust, atmosphere, and the control software reading its sensors wrong.
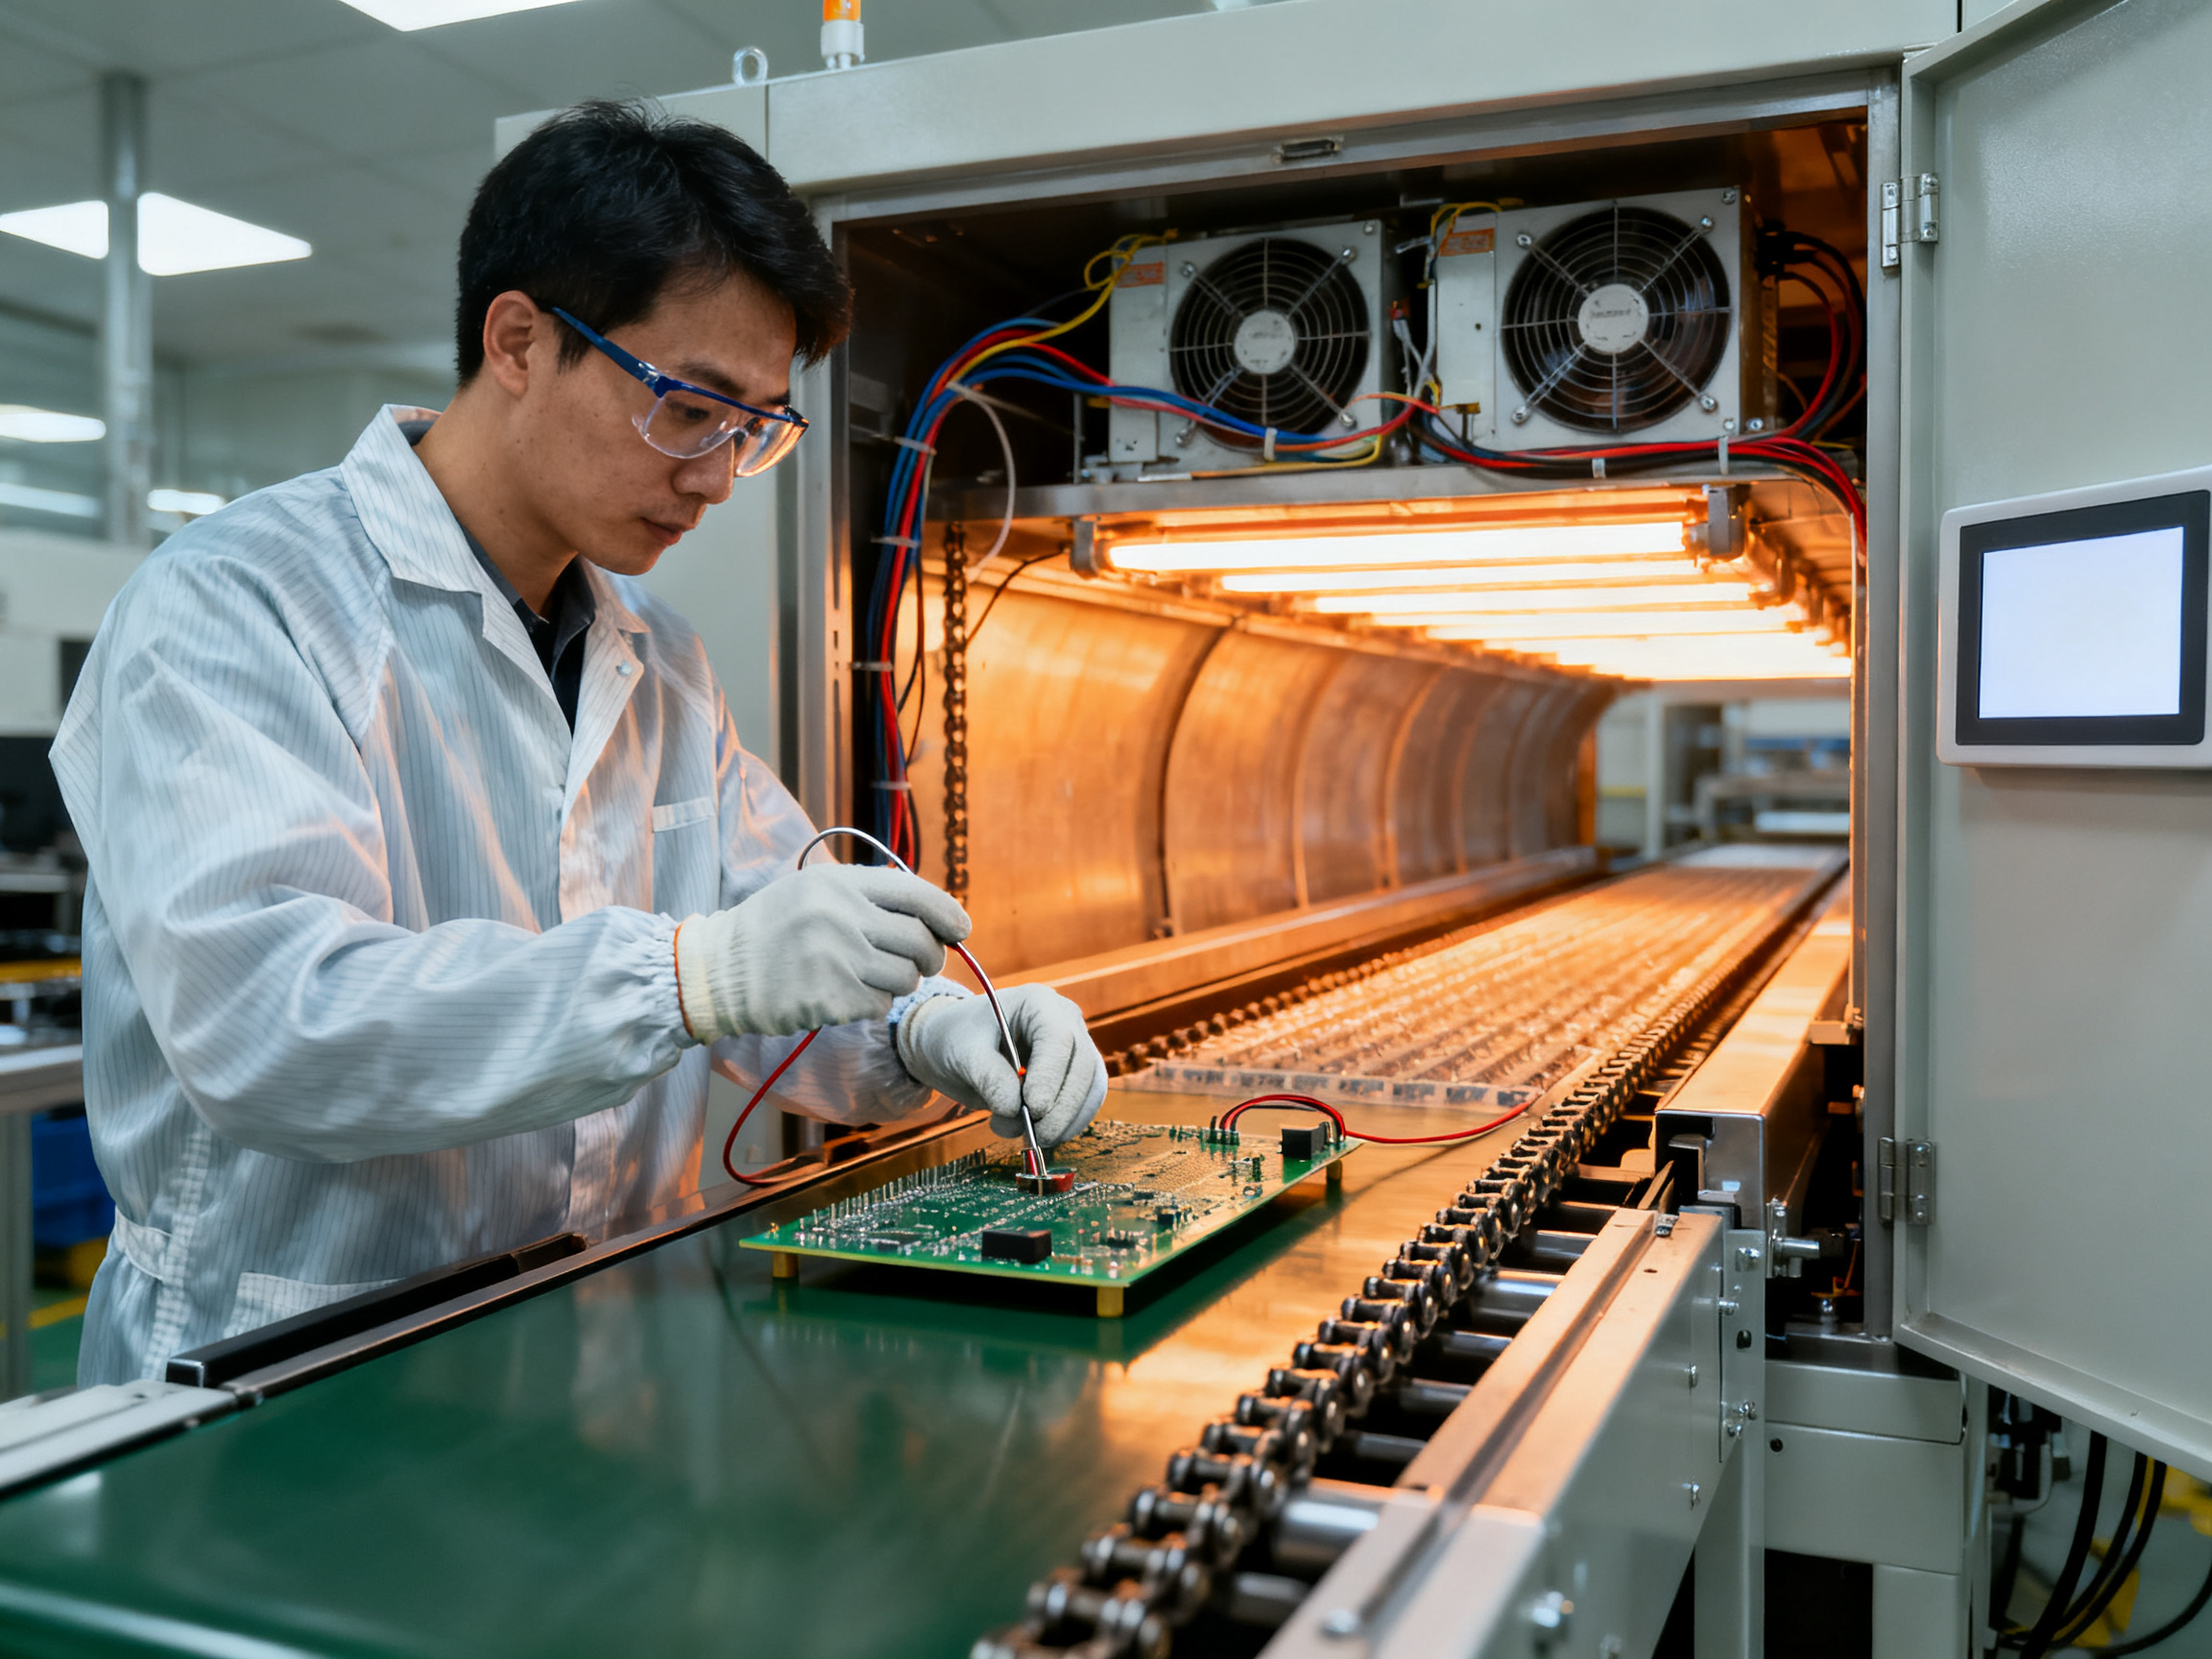
| Symptom | Likely layer | First diagnostic action | Confirming test |
|—|—|—|—|
| Cold joints, dull grainy surfaces | Layer 3 | Pull the profile and check peak and time above liquidus | Cross-section of the joint |
| Bridging between fine-pitch pads | Layer 1 or 2 | Inspect deposit volume and stencil aperture ratio | SPI volume map plus X-ray |
| Slumping or sinking of large deposits | Layer 3 | Review ramp rate and preheat dwell | SPI plus reflow the same lot at a slower ramp |
| Incomplete wetting on QFN pads | Layer 1 or 3 | Compare paste volume against pad and thermal pad area | X-ray of the exposed pad |
| Tombstoning | Layer 2 | Check placement force and offset | AOI review with the recipe |
| Hot spots at one board edge | Layer 4 | Compare oven reported zone curve to a board thermocouple | Profiler run with board mounted probe |
| Head in pillow on BGA | Layer 1 or 3 | Check paste slump, package warpage, soak window | X-ray plus cross-section |
Notice how the first action and the confirming test are different things. Reading a profile tells you what the oven was asked to do. X-ray tells you what actually happened on the joint. Defect analyses that start with eight common PCBA rework causes make the same point in practice.
Now the measurement hierarchy, which is the sequence the rest of this article follows:
- Thermal verification. Profile the board and compare it against the process window.
- Defect capture. SPI for printing, AOI for placement and visible joint condition, X-ray for hidden joints like BGA and QFN.
- Electrical and mechanical confirmation. Cross-section, dye and pry, pull test. This is where you prove whether a joint is actually weak.
That third layer matters because BGA voids and QFN exposed-pad gaps can pass electrical test while still causing field failures later, so a clean test result is not proof of a good joint.
One warning before you go further. The word “cold joint” gets used loosely, but it’s not a diagnosis. It covers insufficient reflow, nonwetting, noncoalescence, disturbed joints, and inadequate intermetallic formation. Each one has a different root cause and a different fix.
Expert Tip: When a symptom shows up on every board, suspect Layer 3 or Layer 4. When it shows up on specific components or pads, suspect Layer 1 or Layer 2. That single question usually saves a teardown.## Section 2: What Reflow Oven Troubleshooting Tool Do You Actually Need? A Buyer’s Framework
Most people asking “what reflow oven troubleshooting tool do I need?” don’t have one problem. They have four, wearing the same coat. So let’s take the coat off first.
The four tiers of reflow troubleshooting tools
| Tier | Tool category | What it actually proves | Typical cost | Best for |
|—|—|—|—|—|
| 1 | Thermal profilers (KIC-style multi-channel profilers with thermocouples) | The real temperature of the board through the whole cycle, not the oven’s opinion | $4,000 to $15,000 | New process development, lead-free profile qualification, any line where peak and time above liquidus are in dispute |
| 2 | Calibrated digital thermocouples and data loggers | Point temperature accuracy at a known location, with a certificate you can hand an auditor | $150 to $900 | Oven calibration checks, drift detection, periodic verification of Tier 1 equipment |
| 3 | Board-level inspection (SPI, AOI, X-ray) | Whether solder was printed, placed, and fused correctly on a specific joint | $4,000 to $150,000 | Finding the defective joint after reflow, BGA and QFN hidden-joint analysis |
| 4 | Physical and mechanical tools (microscope, cross-section kit, dye and pry, wetting coupons) | Whether the joint is metallurgically sound, not just visually acceptable | $200 to $3,000 | Confirming root cause, qualifying a fix, closing out an audit finding |
Notice that Tier 1 and Tier 3 answer different questions. A profiler tells you the board got hot enough. An X-ray tells you the joint formed properly. You need both eventually, but they get bought for different reasons.
Match the spend to the pain point
If you are a production or procurement manager, this is the decision that actually matters, because a profiler you never use is worse than no profiler at all.
| Your situation | Start with | Why |
|—|—|—|
| Single-shift lab, low-mix prototypes, mixed components | Tier 2 logger plus Tier 1 borrowed or rented | You need repeatability on new builds, not a capital purchase |
| 24/7 high-volume line, one product family | Tier 1 profiler, Tier 2 loggers on every zone | Drift shows up as slow yield loss, not as a single dramatic failure |
| Automotive, medical, or military program | All four tiers, with calibration records | Auditors ask for evidence, and evidence is a chain of measurements |
| Recurring BGA and QFN field returns | Tier 3 X-ray plus Tier 4 cross-section | The joint is suspect, so you need to look at the joint |
What the spec sheet words mean in practice
Vendors love three words. Here’s what they mean when you hold the instrument in your hand.
Channel count. How many points you can measure at once. One channel tells you about one location. A board with a large BGA in the middle, small passives on the far side, and a thick copper region on the edge has at least three genuinely different thermal environments. Two channels is enough for a spot check. Five or more is what you want for real profile work.
Sample rate. This is where cheap instruments give themselves away. A 1 Hz logger samples once per second. If your ramp rate is 3 °C per second, one sample per second gives you a reading every 3 °C. That is coarse enough to smooth over a short thermal spike. 10 Hz sampling, meaning a reading every 100 milliseconds, captures the sharp rise and the plateau properly. For lead-free reflow profile work, anything slower than 5 Hz will make your soak and time-above-liquidus numbers questionable, and those two numbers are exactly what the whole process window is built on. TI’s own reflow profile guidance makes the same point about measuring where the real thermal events happen rather than where it is convenient to measure (lead-free reflow profile considerations).
Probe type. Fine-wire thermocouples attach to small components and small pads, and they respond fast. Heavy-wire probes are more accurate on large surfaces but slow to react. A KIC thermocouple profiler kit usually gives you both. For a small 0402 or a QFN corner, use fine wire. For a big BGA lid or a board edge, a heavier attachment gives a truer reading.
Thermal mass. And this is the one that catches people. The board is part of the thermometer. A heavy multilayer board with a large ground plane heats slower than a thin, small panel, so the same recipe produces different results on different product. Your oven’s zone setpoints are not the board’s temperature. Profiling a board that is not representative of production gives you a curve for a board you do not build.
One last practical note. Whatever you buy, decide upfront who recalibrates it and how often, then write that into the maintenance schedule. A Tier 2 thermocouple with a lapsed certificate is worse than no instrument, because it produces confident wrong answers.
If you are still unsure where to start, tell us your product mix and defect symptoms and we will map it to a tool list, no obligation. That is the fastest way to cut a $15,000 purchase down to what you actually need, and skip the rest.
Related reading:
- Lead-free reflow oven selection: matching convection and infrared heating to your board mix
- BGA and QFN X-ray defect analysis for high-reliability assemblies## Section 3 — The Diagnostic Toolkit: Hardware Tools That Solve Real Reflow Problems
Now let’s talk about the actual hardware. Not the software, that is Section 4. The instruments you hold in your hand, and where you put them on the board.
Where the thermocouple goes changes the answer
A thermocouple can sit in three places, and each one tells you something different.
On the component. Fine wire, spot-welded or held with high-temperature tape on a large BGA lid or an aluminium electrolytic cap. This is the closest read to package body temperature, which matters because J-STD-020F limits are defined on the package body, not on the board.
On the PCB edge. Under the board or at a corner, tape-fixed. It reads the board and the air around it, so it runs cooler than the component and reads lower than a package measurement.
In a board pocket. Some lines drill a small hole, insert the probe, and cover it with high-temperature tape. It survives repeated runs, but the hole changes the local thermal mass and the tape adds an insulating layer.
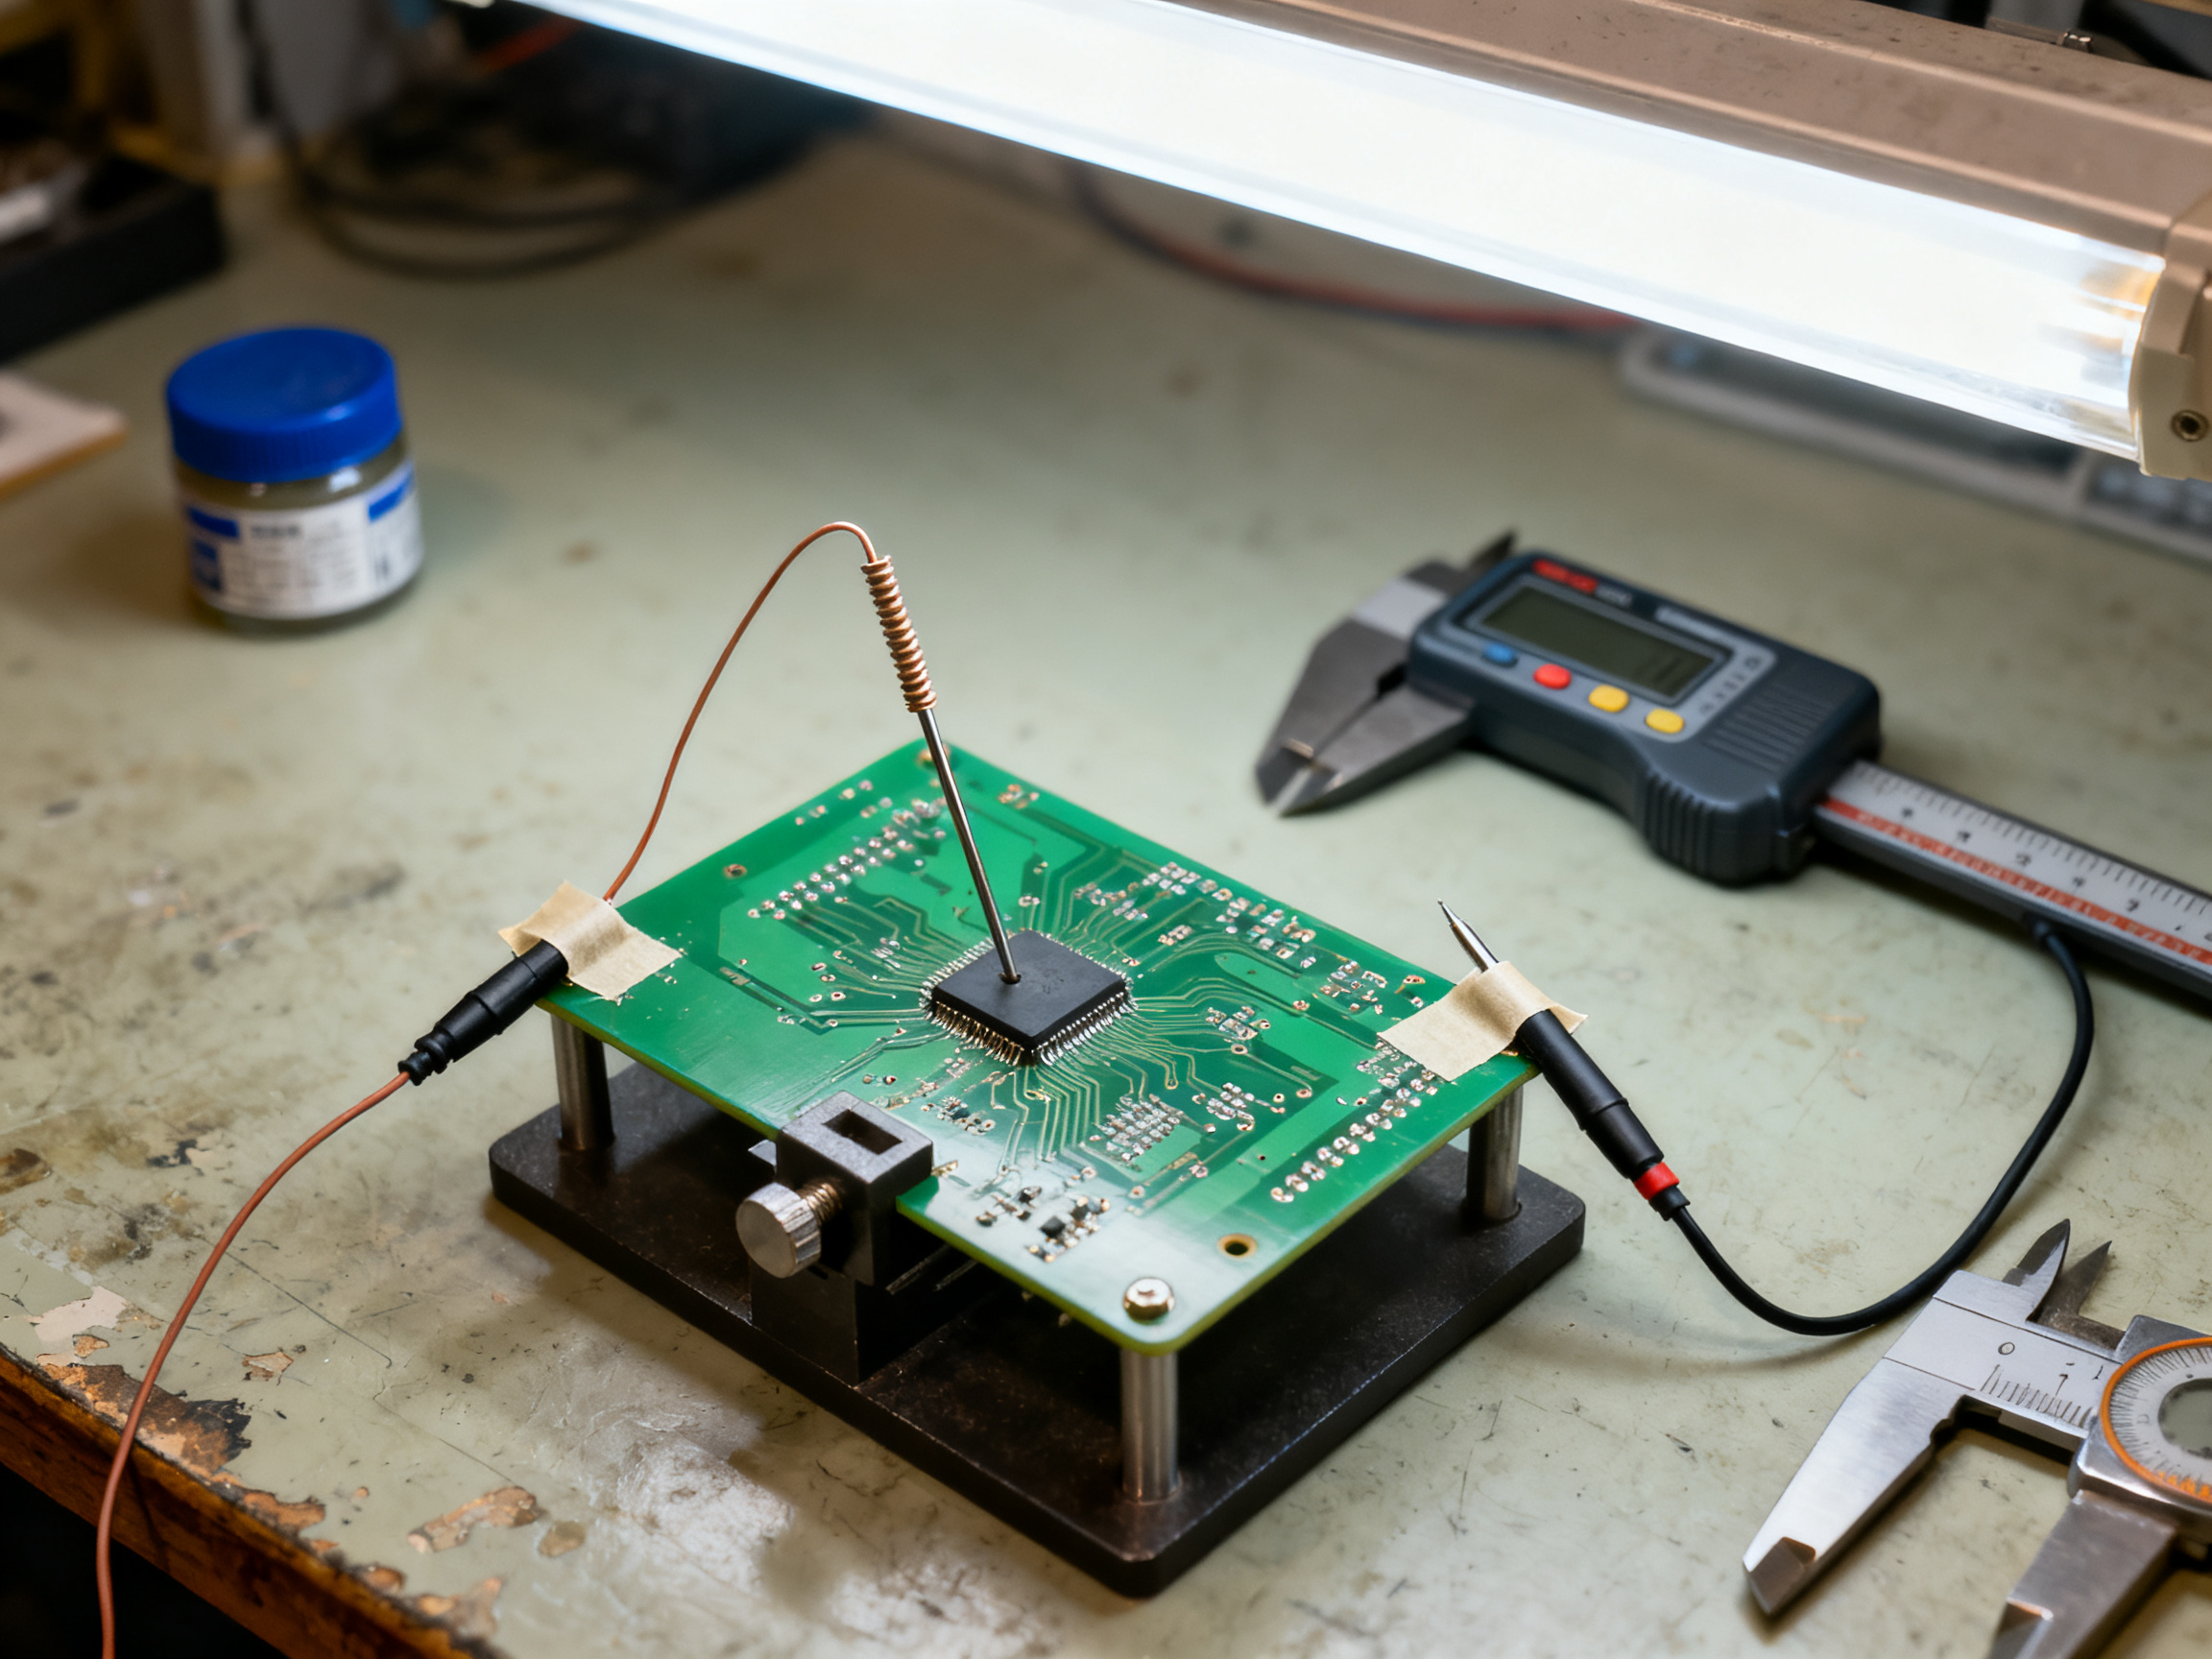
The practical rule I use: measure at the component when you are chasing a component-level limit, and measure at the board when you are chasing what the oven is actually doing. Never mix the two and compare numbers.
Why a cheap probe can ruin a cold-joint investigation
Here is a detail that catches out smart people. Type K thermocouples are made of nickel-chromium and nickel-alumel, two different alloys joined at a junction. If you buy a no-name probe with a gold-plated connector, or one where the junction is crimped rather than welded, the junction itself can generate a false millivolt signal. You get a reading that looks plausible and is wrong by several degrees.
And that matters more than it sounds. A cold-joint investigation is precisely a question of whether you were 5 °C or 10 °C short of liquidus. If your instrument carries 8 °C of error, you are not measuring a profile, you are generating a random number with a confidence interval.
The fix is boring. Buy thermocouples with a traceable calibration certificate, check the certificate expiry date, and use the same type across the line so you can swap probes without re-baselining. For lead-free reflow work on SAC305, where the liquidus sits around 217 to 220 °C, several degrees of error changes the answer completely. Temperature measurement guidance for reflow processes from component manufacturers covers why measuring at the right thermal event matters more than measuring where it is convenient (reflow profile measurement considerations).
The supporting instruments
A profiler tells you the heat history. These tell you whether the oven can deliver that heat consistently.
| Instrument | What it proves | Practical trigger for using it |
|—|—|—|
| Calibrated reference thermometer for chamber air | Whether the oven’s air temperature matches its own reported curve | After any heater, fan, or firmware work |
| Airflow or exhaust anemometer | Whether fans and exhaust filters are moving enough air | Before blaming the profile for a nonwetting problem |
| Load cell or platform scale on the conveyor | Whether the actual board load matches the recipe assumption | When a heavy panel and a light panel share one recipe |
| Stereo microscope with diffuse lighting | Whether a joint is wetting, grainy, or disturbed | Every joint inspection, before any X-ray |
| Cross-section kit, dye and pry | Whether the joint is metallurgically sound inside | Closing a root cause, not opening one |
The scope lighting point deserves emphasis. A joint that looks grainy and dull under ring light can look smooth and acceptable under a properly diffused head. If your inspection lighting is wrong, your operators are making call decisions on images they cannot trust. That is a process defect, not a workmanship defect.
How the tools chain together
Put the pieces in order and the reasoning becomes obvious:
- Profile measurement proves the thermal cause, or rules it out.
- SPI and AOI show whether solder was deposited and whether the joint looks right.
- X-ray and cross-section prove whether the joint formed properly inside.
The profiler is the only instrument in that chain that can establish or eliminate a thermal root cause. SPI and X-ray are excellent at finding bad joints, but they cannot tell you whether a cold joint happened because the peak was low, the soak was short, or the sensor lied. That answer only comes from measurement.
Pro Insight: A $200 calibrated thermocouple with a certificate often outperforms a $15,000 profiler for detecting drift, because the expensive machine measures beautifully on the day you unbox it and nobody recalibrates the sensor inside the oven. Build the certificate trail now: purchase records, calibration certificates with dates, the verification result each quarter, and the serial number of each instrument. For an aerospace or military audit, that chain is the deliverable. If a verification reading drifts more than 1 to 2% from the last baseline, treat it as a trigger to re-baseline the profile rather than a rounding error to note in a logbook.
Now let’s move to the thing that produces those numbers, and where it can quietly disagree with them.